NIFTY TECHNICAL OUTLOOK
Based on Market Closing on Friday, July 5, 2024
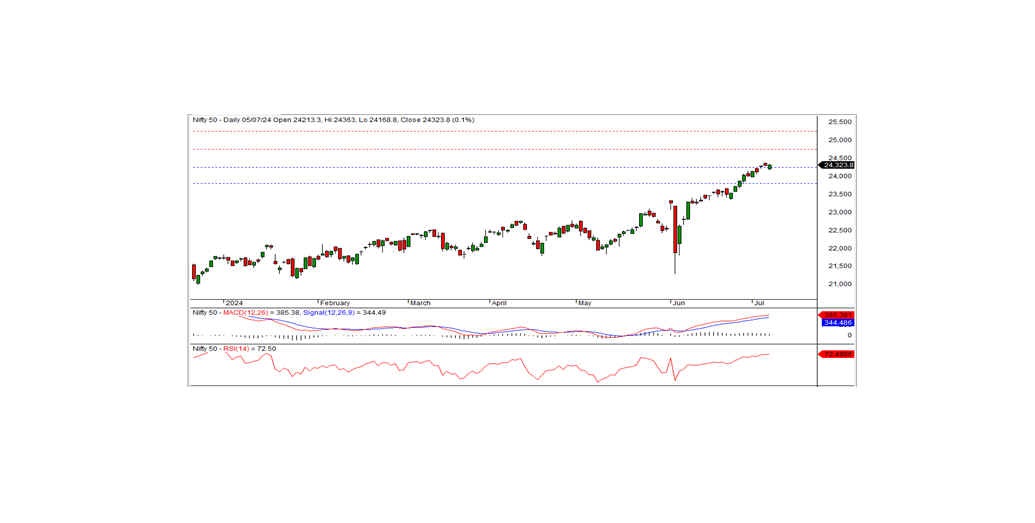
In the last trading session, the Nifty closed at 24,323.85, up 152.70 points or 0.09 percent. The bullish trend will continue if the index remains above the 24,300 level.
The Nifty opened at 24,213.30 with a negative bias and hit an intraday low of 24,168.80 in the morning trade. The index gradually rose, tested an intraday high of 24,363, and finally closed at 24,323.85. The major gainers were the pharma, PSU banks, FMCG, and metal sectors, while the losers were financial services, banks, and realty. The market breadth was positive, with 1,467 stocks rising, 1,060 falling, and 108 remaining unchanged. The top gainers in the Nifty index were ONGC, SBIN, RELIANCE, and SUN BRITANNIA. On the other hand, the major losers included HDFCBANK, TITAN, TATA STEEL, and M&M.
From a technical standpoint, the momentum indicators signal a positive trend. Notably, the RSI remains above the seventy level. If it stays above this level, a further bullish trend can be expected in the coming days. The Nifty remains above the long-term and short-term moving averages. Moreover, the index formed a white candle on the daily chart and closed above the previous day's close. This pattern indicates the continuation of the bullish trend. On the lower side, the index has short-term support at the 24,300 level. The bullish trend can continue today if the index trades and sustains above this level. The nearest intraday resistance is at 24,400 levels.
Intraday Levels: Support: 24,300, 24,225, 24,150 Resistance: 24,400, 24,475-24,550 (15-Minute Charts)
Positional Trading: Short-term support: 24,250-23,800 Resistance: 24,750-25,250
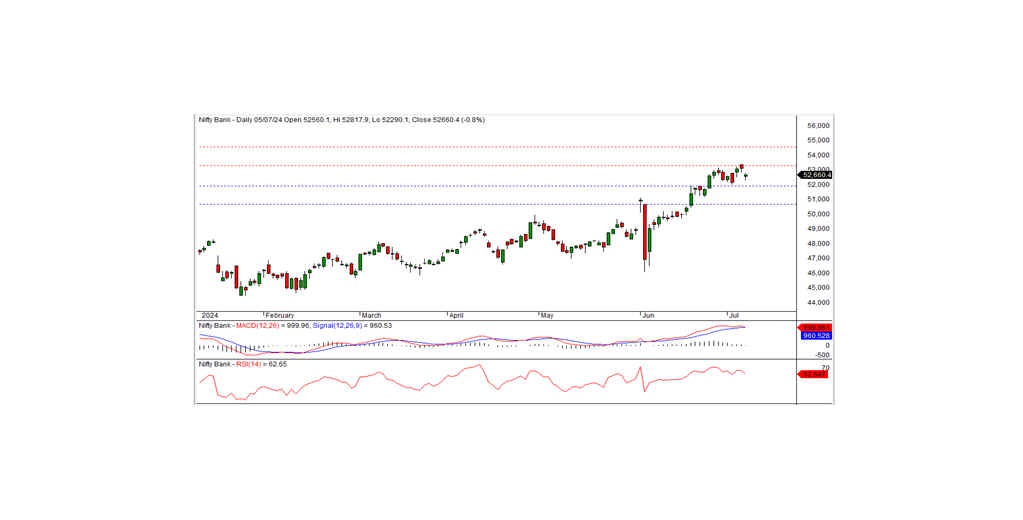
BANK NIFTY
In the preceding trading session, Bank Nifty closed at 52,660.35, registering a loss of 443.35 points. Technically, the momentum indicators signal a positive trend, and the index remains above the medium-term and long-term moving averages. The index formed a white candle on the daily chart but closed below the previous day's close. On the lower side, the index has short-term support at the 52,000 level. If the index moves below this level, the downtrend can continue in the coming days. Otherwise, the index may consolidate above this level for a few days. The nearest intraday resistance is at 52,800 levels.
For intraday traders, the support levels are at 52,500, 52,200, and 51,900, while resistance levels can be identified at 52,800, 53,200, and 53,500 as indicated by the 15-minute charts.
Positional traders should monitor short-term support levels at 51,900-50,650, with resistance at 53,250-54,500.