NIFTY TECHNICAL OUTLOOK
Based on Market Closing on Friday, August 9, 2024
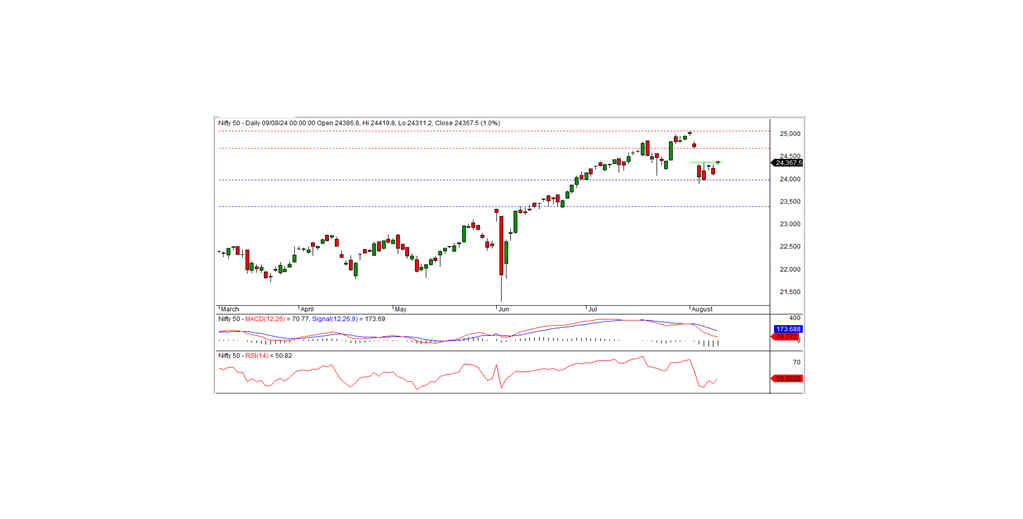
In the last trading session, the Nifty closed at 24,367.50, up by 250.50 points or 1.04%. The positive trend is likely to continue if the index remains above the intraday support level of 24,350.
The session began with a positive bias, opening at 24,386.80. This momentum continued as the index tested an intraday high of 24,419.80 before closing at 24,367.50. All sectors closed on a positive note, with PSU banks, media, auto, and IT sectors being the biggest gainers. The market breadth was positive, with 1,476 stocks rising, 1,083 falling, and 110 remaining unchanged. The top gainers in the Nifty index were Eicher Motors, ONGC, Shriram Finance, and Tech Mahindra, while the major losers included BPCL, HDFC Life, Kotak Mahindra Bank, and Sun Pharma.
From a technical standpoint, momentum indicators still signal a negative trend, and the Nifty remains below its short-term moving averages. Although the index formed a black candle on the daily chart, it closed above the upper bound of the recent trading range, suggesting a positive bias. On the downside, the index has intraday support at the 24,350 level, with resistance at 24,500. If the index stays above 24,350, it may attempt to fill the gap area between 24,350 and 24,685 that was formed a few days back. Otherwise, the recent consolidation could persist for a few more days.
Intraday Levels: Support: 24,350, 24,100, 23,925 Resistance: 24,500, 24,700-24,900 (15-Minute Charts)
Positional Trading: Short-term Support: 24,000-23,400 Resistance: 24,685-25,080
BANK NIFTY TECHNICAL OUTLOOK
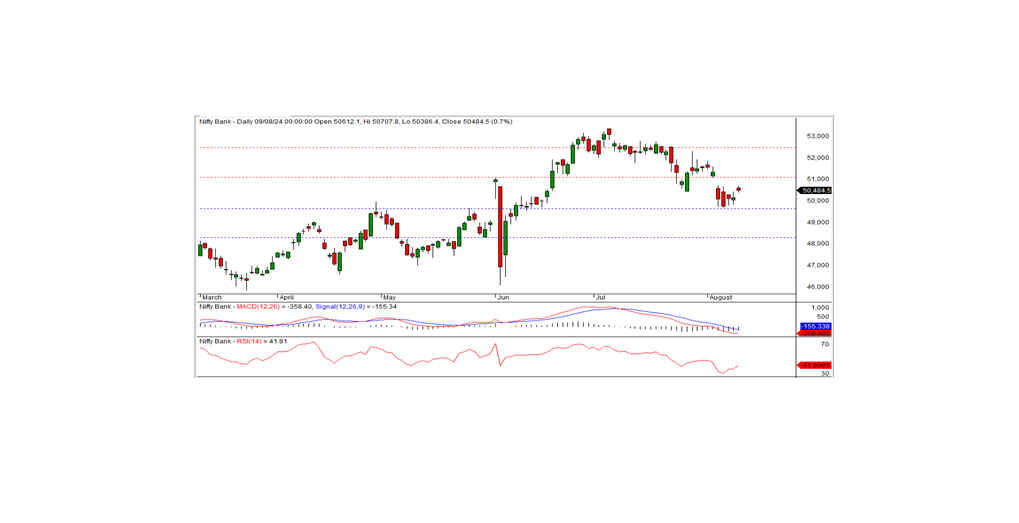
In the preceding trading session, Bank Nifty closed at 50,484.50, registering a gain of 327.80 points. Despite this gain, momentum indicators continue to suggest a downward trend, with the index remaining below its short-term moving averages. The index formed a black candle on the daily chart but managed to close above the previous day's close, indicating the potential for the uptrend to continue.
On the downside, the index has intraday support at the 50,300 level, with resistance at 50,600. The positive trend is likely to persist if the index moves above the resistance level. If it fails to do so, consolidation below this level could occur for a few days. The short-term support remains at the 49,600 level.
Intraday Levels: Support: 50,300, 50,000, 49,800 Resistance: 50,600, 50,800, 51,000 (15-Minute Charts)
Positional Trading: Short-term Support: 49,600-48,300 Resistance: 51,000-52,450