NIFTY TECHNICAL OUTLOOK
Based on Market Closing on Monday, December 16, 2024
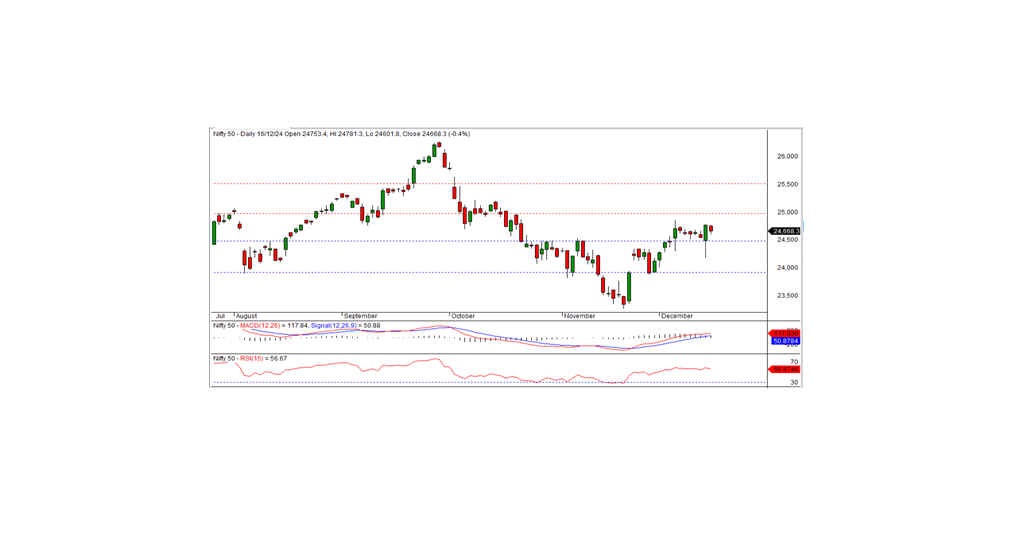
The Nifty closed at 24,668.25, down 100.05 points or 0.40% in the preceding session. The downtrend may continue if the index falls below the critical support level of 24,600.
In the last session, Nifty opened on a negative note at 24,753.40 and briefly tested the intraday high of 24,781.30 in early trade. However, the index faced selling pressure, gradually falling to the intraday low of 24,601.80 before closing at 24,668.25. Sector-wise, realty, media, PSU banks, and pharma were the biggest gainers, while metal, IT, FMCG, and financial services sectors underperformed. Market breadth remained positive, with 1,464 stocks advancing, 1,221 declining, and 116 remaining unchanged. The top gainers in the Nifty were DRREDDY, INDUSINDBK, HDFCLIFE, and BAJFINANCE, while TITAN, ADANI PORTS, TCS, and HINDALCO were the major losers.
From a technical perspective, momentum indicators continue to signal a positive trend as the Nifty trades above its short-term moving averages. However, the formation of a small black candle on the daily chart, coupled with a close within the previous day’s range, suggests a possible phase of consolidation. On the downside, immediate intraday support lies at 24,600, and a move below this level may trigger a mildly negative trend. For any recovery, the index must break above the nearest intraday resistance at 24,700, which could pave the way for further upside.
In conclusion, while the Nifty remains technically strong above key support levels, a break below 24,600 could lead to short-term weakness. Traders should watch for a breakout above 24,700 for renewed bullish momentum.
Intraday Levels: Support: 24,600, 24,500, 24,400 Resistance: 24,700, 24,800–24,900
Positional Trading Levels: Short-term Support: 24,500–23,800 Resistance: 25,000–25,500

BANK NIFTY TECHNICAL OUTLOOK
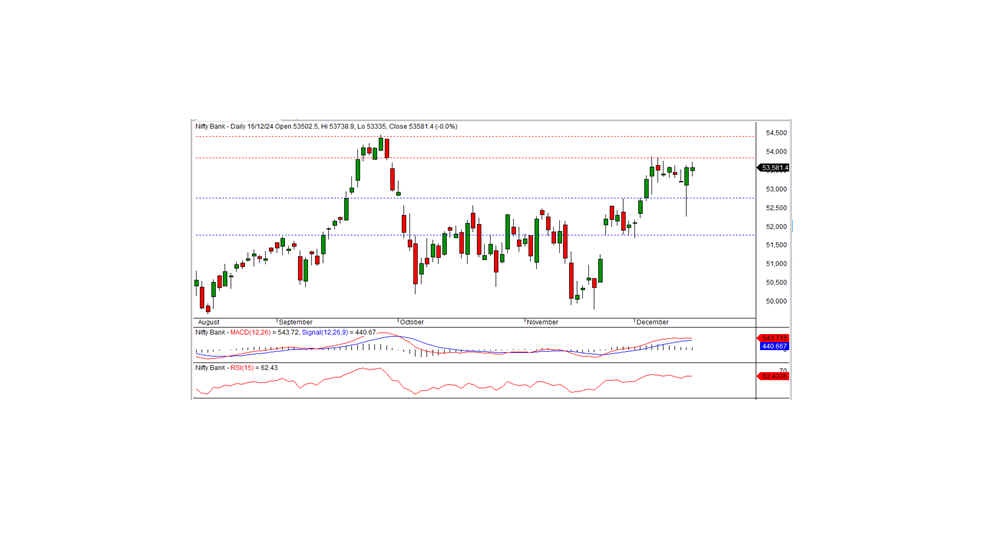
In the preceding session, Bank Nifty closed at 53,581.35, registering a marginal loss of 2.45 points. Technically, momentum indicators continue to signal a positive trend as the index remains above its short-term and long-term moving averages. On the daily chart, the index formed a white candle but closed slightly below the previous day's close, suggesting a possible phase of consolidation.
On the higher side, immediate intraday resistance lies at 53,670. For the bullish trend to resume, the index must decisively move above this level. Conversely, the nearest intraday support is at 53,400, and a breakdown below this could signal further weakness.
In summary, Bank Nifty remains in a positive zone but is consolidating. A breakout above 53,670 would confirm bullish momentum, while traders should closely monitor the 53,400 support level for signs of further weakness.
As per the 15-minute charts, intraday support levels are at 53,400, 53,200, and 53,000, while resistance levels are at 53,670, 53,900, and 54,150.
For positional traders, key short-term support is seen at 52,750–51,750, with resistance in the range of 53,850–54,500.

