NIFTY Technical Outlook
Based on Market Closing on Wednesday, October 09, 2024
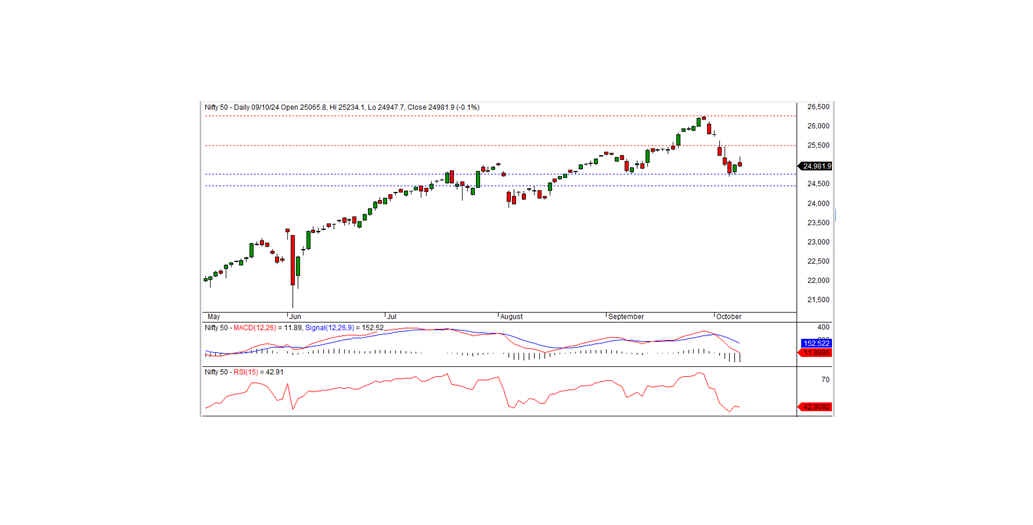
In the last trading session, Nifty closed at 24,981.95, marking a decline of 31.20 points (-0.12%). The negative bias may persist if the index sustains below the intraday support level of 24,950.
Nifty opened positively at 25,065.80 and tested the intraday high of 25,234.10 in the morning session. However, it failed to maintain momentum and gradually declined, hitting an intraday low of 24,947.70 before closing at 24,981.95. The strongest sector performers were realty, pharma, media, and auto, while FMCG and banking led the losers. Market breadth remained positive, with 1,910 stocks advancing, 882 declining, and 82 remaining unchanged. The top Nifty gainers were Cipla, Trent, Tata Motors, SBI, and Tech Mahindra, whereas ITC, Nestle India, ONGC, and Reliance were among the major losers.
From a technical perspective, momentum indicators continue to signal a negative trend, with Nifty remaining below its short-term moving averages. Additionally, the daily chart shows the formation of a black candle, which closed below the previous day's close, suggesting a slightly negative outlook. On the downside, 24,950 acts as immediate support. If the index breaks below this level, the downtrend may continue. On the upside, resistance is seen at 25,050. A shift to a positive trend requires Nifty to move and sustain above this resistance.
Intraday Levels: Support: 24,950, 24,835, 24,700 Resistance: 25,050, 25,140, 25,235 (15-Minute Charts)
Positional Trading Levels: Short-term support: 24,750 – 24,450 Resistance: 25,500 – 26,275
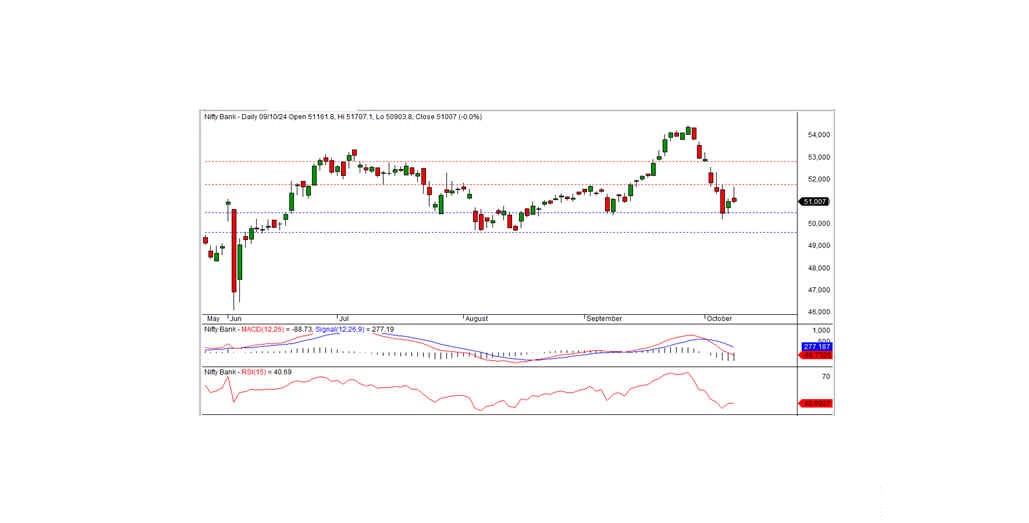
BANK NIFTY Technical Outlook
In the previous trading session, Bank Nifty closed at 51,007.00, reflecting a minor loss of 14.00 points. From a technical standpoint, momentum indicators signal a negative trend, as the index remains below its short-term moving averages. Additionally, a black candle formed on the daily chart, closing below the prior day's close, which suggests a negative bias for the index.
On the downside, immediate intraday support is seen at 51,000, while resistance stands at 51,215. A shift to a positive trend requires the index to break above the 51,215 resistance level; otherwise, Bank Nifty may continue to consolidate below this level for a few more days.
For intraday traders, support levels to watch are 51,000, 50,650, and 50,350, while resistance levels are placed at 51,215, 51,500, and 51,800.
For positional traders, key short-term support is found at 50,500–49,600, with resistance levels at 51,750–52,800.