NIFTY TECHNICAL OUTLOOK
Based on Market Closing on Thursday, July 18, 2024
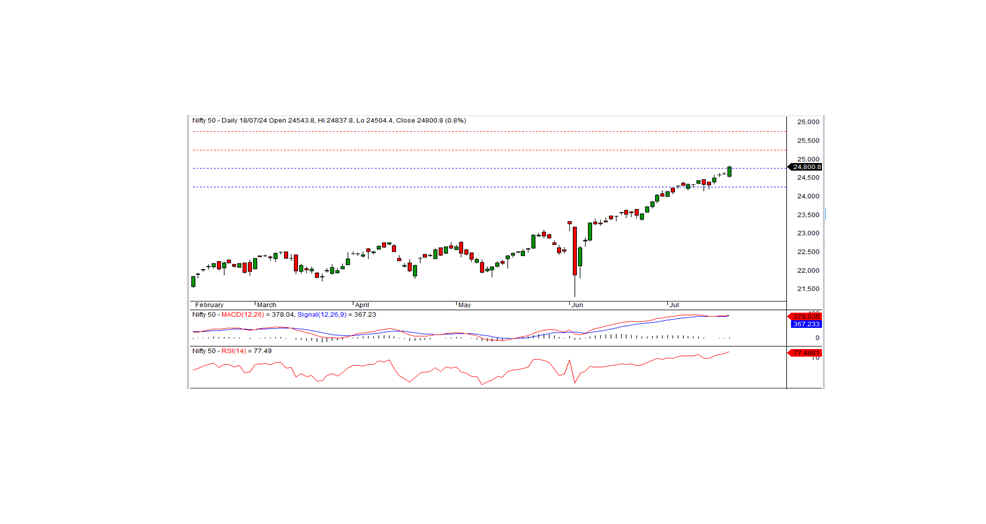
In the last trading session, the Nifty closed at 24,800.80, up 187.85 points or 0.76 percent. The positive trend is expected to continue if the index moves above the intraday support level of 24,750.
During the session, the Nifty opened at 24,543.80 with a negative bias, then gradually rose, tested a record high of 24,837.80, and closed at 24,800.80. The IT, FMCG, financial services, and banking sectors were the top gainers, while the media, metal, and realty sectors were the losers. Market breadth was negative with 788 stocks rising, 1,767 falling, and 85 remaining unchanged. The top gainers in the Nifty index were LTIM, TCS, ONGC, and BAJAJFINSV, whereas ASIAN PAINTS, COAL INDIA, HEROMOTOCO, and GRASIM were the major losers.
From a technical standpoint, momentum indicators signal a positive trend. The Nifty remains above both long-term and short-term moving averages. Additionally, the index formed a white candle on the daily chart and closed at a record high, indicating the possibility of a continuing bullish trend. The nearest intraday support is at 24,750 levels. If the index remains above this level, the bullish trend is likely to continue in the coming days. On the higher side, the index faces intraday resistance at 24,850 levels.
Intraday Levels: Support: 24,750, 24,665, 24,575 Resistance: 24,850, 24,925-25,000 (15-Minute Charts)
Positional Trading: Short-term Support: 24,750-24,250 Resistance: 25,250-25,750
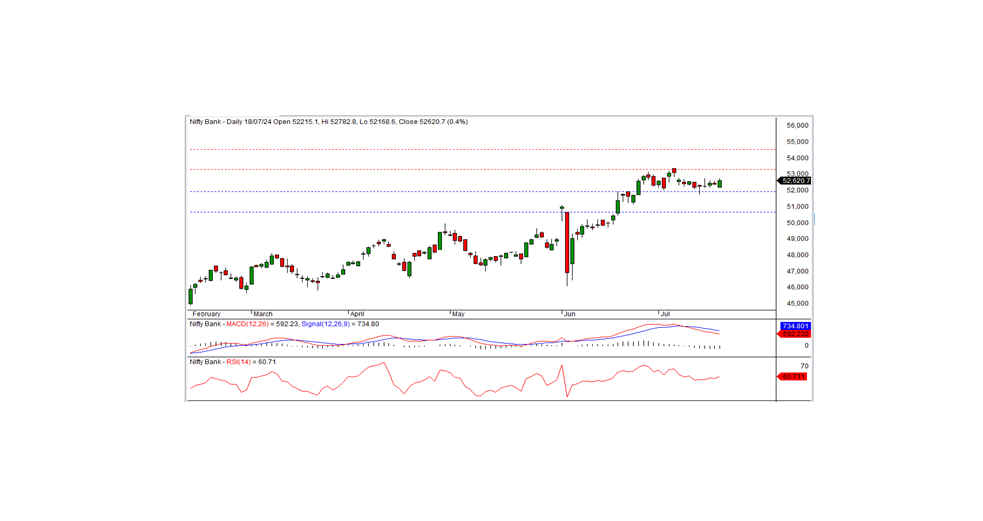
BANK NIFTY TECHNICAL OUTLOOK
In the preceding trading session, Bank Nifty closed at 52,620.70, registering a gain of 223.90 points. Technically, the momentum indicators signal a neutral trend. The index remains above the long-term and medium-term moving averages. Moreover, the index formed a white candle on the daily chart and closed above the previous few days' close, indicating a positive bias for the index. On the higher side, the index has intraday resistance at the 52,800 level. If the index closes above this level, the bullish trend can continue in the coming days. Otherwise, the index may continue the recent consolidation above the support level of 51,900 for a few more days.
Intraday Levels: Support: 52,600, 52,400, 52,200 Resistance: 52,800, 53,000, 53,200 (15-Minute Charts)
Positional Trading: Short-term Support: 51,900-50,650 Resistance: 53,250-54,500