NIFTY TECHNICAL OUTLOOK
Based on Market Closing on Monday, October 21, 2024
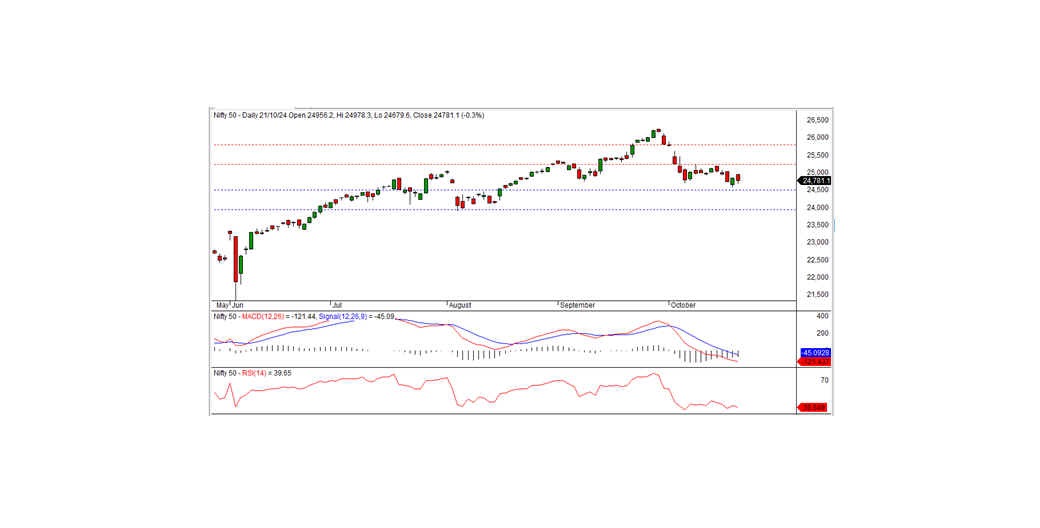
In the last trading session, Nifty closed at 24,781.10, down by 72.95 points (-0.29%). The index may continue its downward trend if it moves below the key intraday support level of 24,700.
Nifty opened positively at 24,956.20 and reached an intraday high of 24,978.30 during the morning session. However, the index gradually declined, hitting an intraday low of 24,679.60 before settling at 24,781.10. Most sectors ended the day in negative territory, with only the auto and financial services sectors showing resilience. The media, metal, realty, and IT sectors were the biggest losers. Market breadth was negative, with 1,995 stocks advancing, 629 declining, and 122 remaining unchanged. Among the top Nifty gainers were BAJAJ-AUTO, HDFCBANK, ASIANPAINT, and M&M, while TATACONSUM, KOTAKBANK, BAJAJFINSV, and BPCL led the losers.
On the technical front, momentum indicators continue to suggest a bearish outlook, with the Nifty trading below its short- and medium-term moving averages. Additionally, the formation of a black candle on the daily chart and a close below the previous session’s level points to a continued negative bias. The index has immediate support at the 24,700 level, while resistance is seen at 24,800. The key level to watch is the 24,700 support; a sustained break below this level could extend the downtrend. However, if Nifty holds above 24,700 and breaks above the 24,800 resistance, it could signal a potential recovery. Traders should monitor these levels closely for both intraday and positional opportunities.
Intraday Levels Support: 24,700, 24,600, 24,500 Resistance: 24,800, 24,900-25,000 (15-Minute Charts)
Positional Trading Levels Short-term Support: 24,500, 24,000 Resistance: 25,250, 25,800
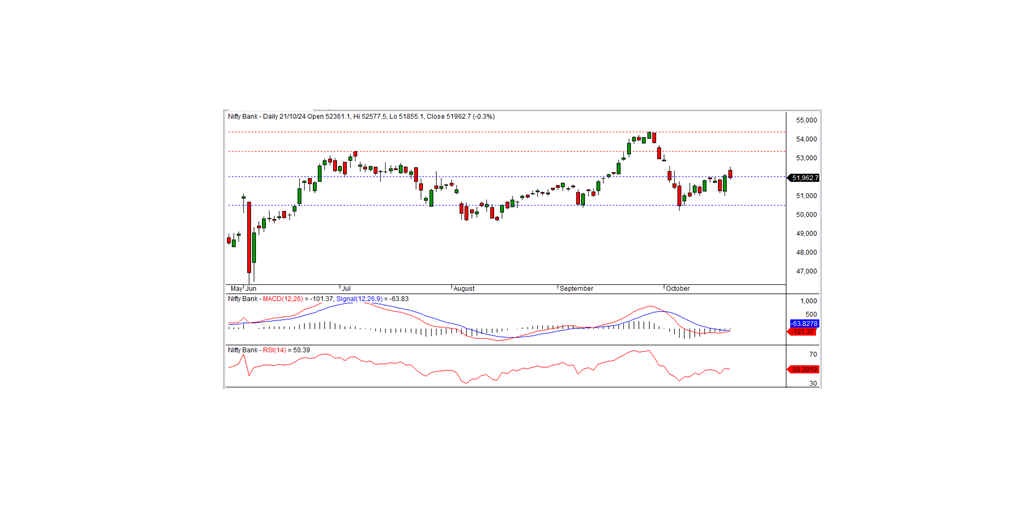
BANK NIFTY TECHNICAL OUTLOOK
In the last trading session, Bank Nifty closed at 51,962.70, posting a decline of 131.50 points. From a technical perspective, momentum indicators suggest a neutral trend, with the index remaining above its short-term moving averages. However, the formation of a black candle on the daily chart, along with a close just below the key support level of 52,000, indicates a slightly negative bias.
On the downside, the index has immediate intraday support at 51,800, while resistance is seen at 52,100. Bank Nifty shows a neutral trend, but the formation of a black candle and a close below the key 52,000 support level suggests a slight negative bias. The index's next move will depend on whether it holds above the 51,800 intraday support level. A break below this could extend the downtrend, while holding above may lead to consolidation. Traders should keep an eye on the key levels for both intraday and positional strategies.
According to the 15-minute charts, intraday traders should monitor the following levels: Support: 51,800, 51,600, 51,400 Resistance: 52,100, 52,400, 52,600
For positional traders, short-term support is at 52,000–50,500, while resistance is positioned at 53,350–54,400.