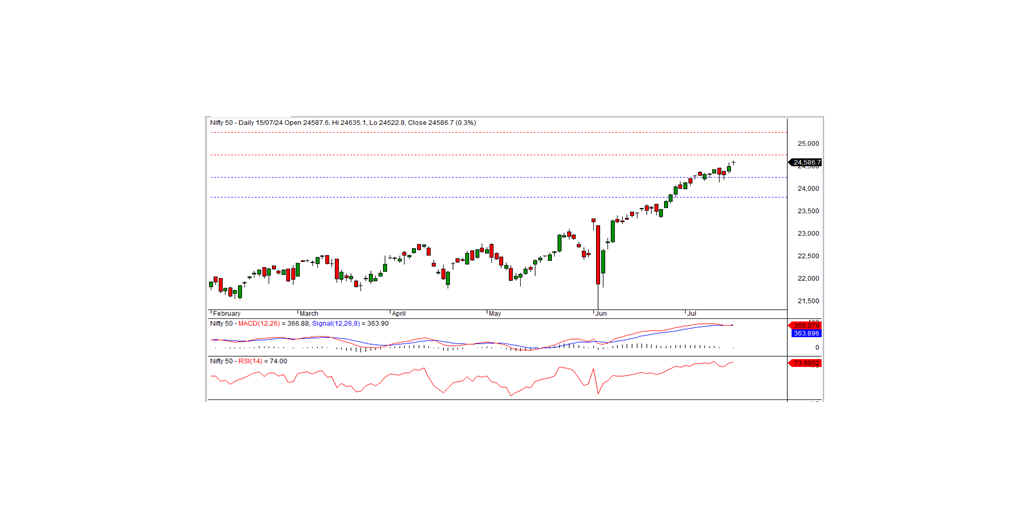
NIFTY TECHNICAL OUTLOOK
Based on Market Closing on Monday, July 15, 2024
In the last trading session, the Nifty closed at 24,586.70, up 84.55 points or 0.35 percent. The positive trend will continue if the index remains above the intraday support level of 24,550.
The Nifty opened at 24,587.60 with a positive bias, hitting an intraday low of 24,522.80 in the morning trade before rising to a record high of 24,635.10 and closing at 24,586.70. All sectors, except IT, closed on a positive note. The major sector gainers were PSU banks, media, realty, and pharma. The market breadth was positive with 1,320 stocks rising, 1,225 falling, and 95 remaining unchanged. The top gainers in the Nifty index were ONGC, SBILIFE, SHRIRAMFIN, and BAJAJ-AUTO, while the major losers included LTIM, ASIANPAINT, GRASIM, and TATASTEEL.
From a technical standpoint, the momentum indicators signal a positive trend. The Nifty remains above both its long-term and short-term moving averages. Additionally, the index formed a Doji candle on the daily chart and closed at a record high, indicating the possibility of continuing the bullish trend. The nearest intraday support is at 24,550 levels. If the index remains above this level, the bullish trend is likely to continue in the coming days. On the higher side, the index has intraday resistance at 24,635 levels.
Intraday Levels: Support: 24,550, 24,460, 24,380 Resistance: 24,635, 24,700-24,750 (15-Minute Charts)
Positional Trading: Short-term support: 24,250-23,800 Resistance: 24,750-25,250
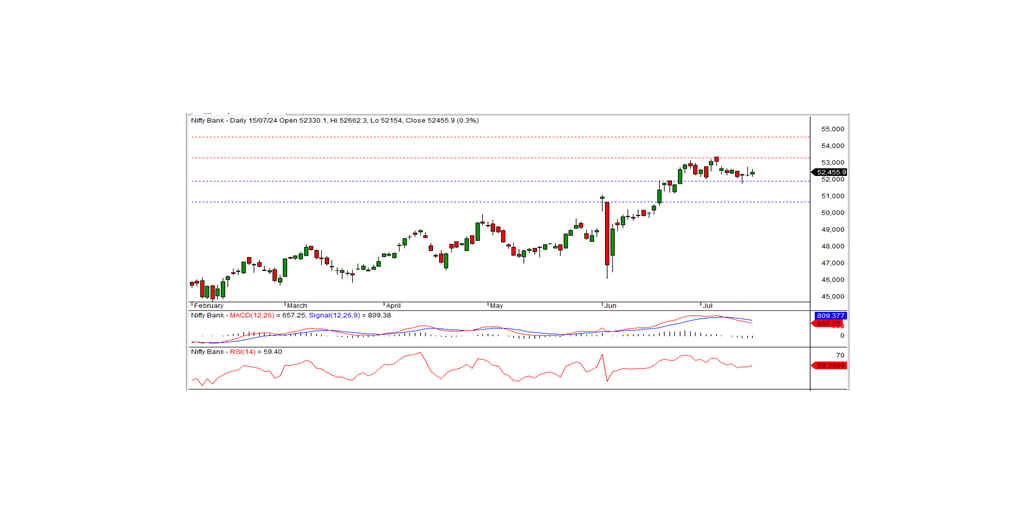
BANK NIFTY
In the preceding trading session, Bank Nifty closed at 52,455.90, registering a gain of 177.00 points. Technically, the momentum indicators signal a negative trend despite the index remaining above the long-term and medium-term moving averages. The index formed a small white candle on the daily chart and closed above the previous day's close, indicating a positive bias.
On the higher side, the index has intraday resistance at the 52,600 level. If the index moves above this level, the positive trend can continue. Otherwise, the index may remain in a consolidation phase above the support level of 51,900 for a few more days.
Intraday Levels: Support: 52,350, 52,100, 51,900 Resistance: 52,600, 52,850, 53,050 (15-Minute Charts)
Positional Trading: Short-term support: 51,900-50,650 Resistance: 53,250-54,500