Nifty Technical Outlook
Based on Market Closing on Friday, August 16, 2024
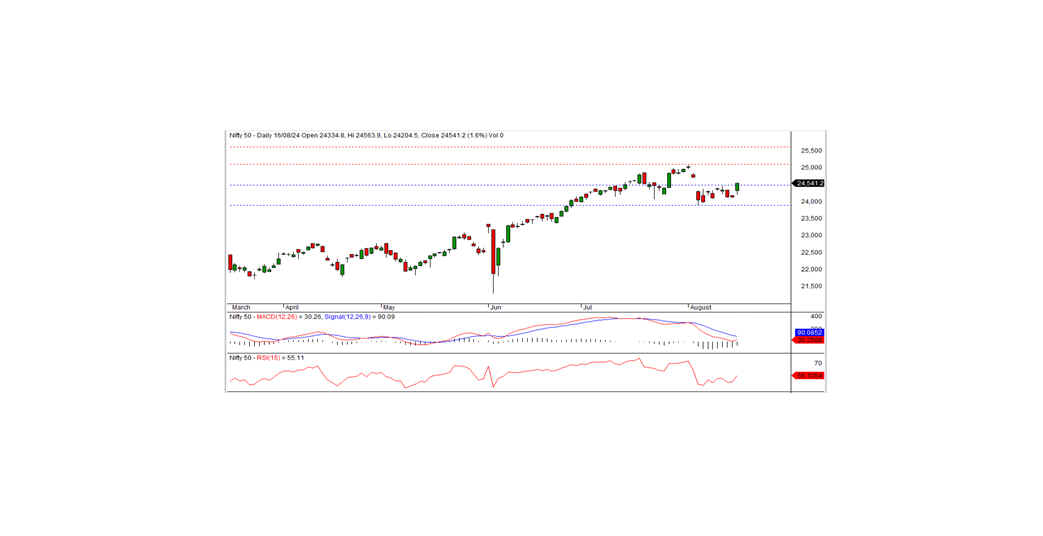
In the last trading session, the Nifty closed at 24,541.15, up 397.40 points or 1.65%. The positive trend will likely continue if the Nifty surpasses the intraday resistance at 24,575.
The Nifty opened on a positive note at 24,334.80, and this trend continued throughout the session and tested the intraday high of 24,563.90, before closing at 24,541.15. All sectors ended with gains, led by IT, realty, media, and auto sectors. The market breadth was positive, with 1,659 stocks advancing, 918 declining, and 96 remaining unchanged. Top gainers in the Nifty index included Wipro, Tech Mahindra, Grasim, and M&M, while the major losers were Divi's Labs, SBI Life, and Dr. Reddy's.
From a technical standpoint, momentum indicators signal a neutral trend, though the Nifty closed above its short-term moving averages. Additionally, the index formed a white candle on the daily chart and closed near the day's high, indicating the potential for a continued bullish trend. On the higher side, the index faces intraday resistance at 24,575. If it surpasses this level, the bullish momentum is expected to persist in the coming days. The nearest short-term support is at 24,475.
Intraday Levels: Support - 24,475, 24,400, 24,325 Resistance - 24,575, 24,650-24,725 (15-Minute Charts)
Positional Trading: Short-term support - 24,475-23,900 Resistance - 25,100-25,600
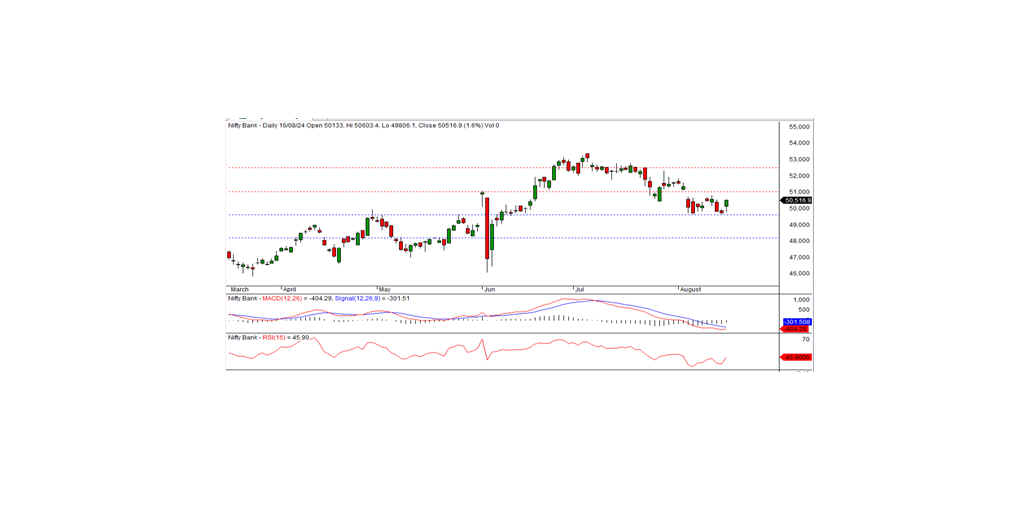
Bank Nifty
In the preceding trading session, Bank Nifty closed at 50,516.90, gaining 789.60 points. From a technical perspective, momentum indicators suggest a downward bias, although the index closed above its short-term moving averages. Additionally, the index formed a white candle on the daily chart and closed near the day's high, indicating the possibility of a continued uptrend.
On the upside, the index has intraday resistance at the 50,600 level, while support is at 50,350. If the index moves above 50,600, further bullish momentum can be expected in the coming days.
For intraday traders, support levels are at 50,350, 50,150, and 49,950, while resistance levels can be identified at 50,600, 50,800, and 51,000, as indicated by the 15-minute charts.
Positional traders should monitor short-term support levels at 49,600-48,200, with resistance at 51,000-52,500.