NIFTY TECHNICAL OUTLOOK
Based on Market Closing on Tuesday, July 09, 2024
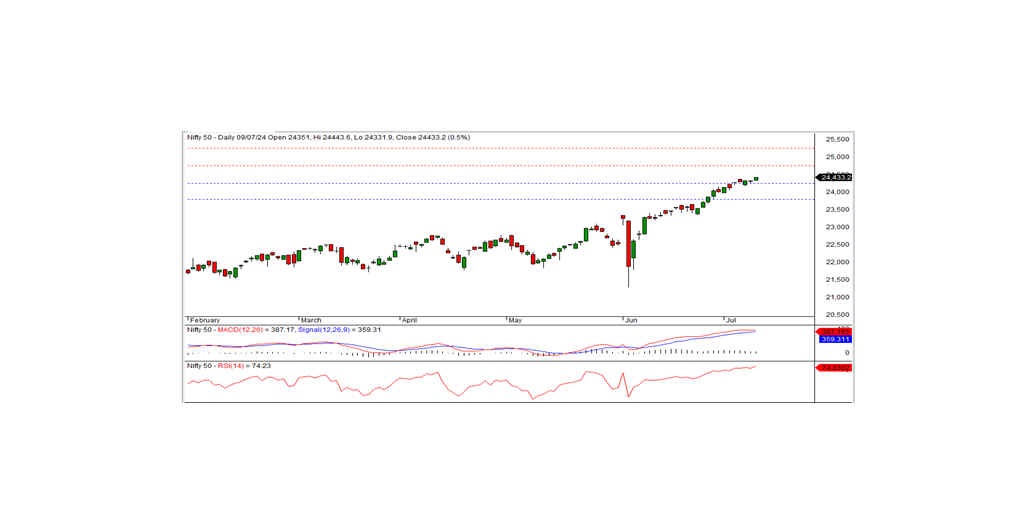
In the last trading session, the Nifty closed at a record high of 24,433.20, up 112.65 points or 0.46 percent. The bullish trend is expected to continue if the index remains above the intraday support level of 24,400.
The Nifty opened at 24,351.00 with a positive bias, and this trend continued throughout the session, reaching a record high of 24,443.60 before closing at 24,433.20. All sectors, except IT, closed with a positive bias. The major sector gainers were auto, pharma, PSU banks, and realty. The market breadth was negative, with 1,208 stocks rising, 1,325 falling, and 102 remaining unchanged. The top gainers in the Nifty index were MARUTI, M&M, ITC, and DIVISLAB, while the major losers included TATACONSUM, RELIANCE, ONGC, and SHRIRAMFIN.
From a technical standpoint, the momentum indicators signal a positive trend. The Nifty remains above the long-term and short-term moving averages. Moreover, the index formed a white candle on the daily chart and closed near the record high. This pattern indicates the possibility of continuing the bullish trend. On the lower side, the index has short-term support at the 24,400 level. If the index trades and sustains above this level, the bullish trend can continue today. The nearest intraday resistance is at the 24,475 level.
Intraday Levels: Support: 24,400, 24,325, 24,250 Resistance: 24,475, 24,550-24,625 (15-Minute Charts)
Positional Trading: Short-term support: 24,250-23,800 Resistance: 24,750-25,250
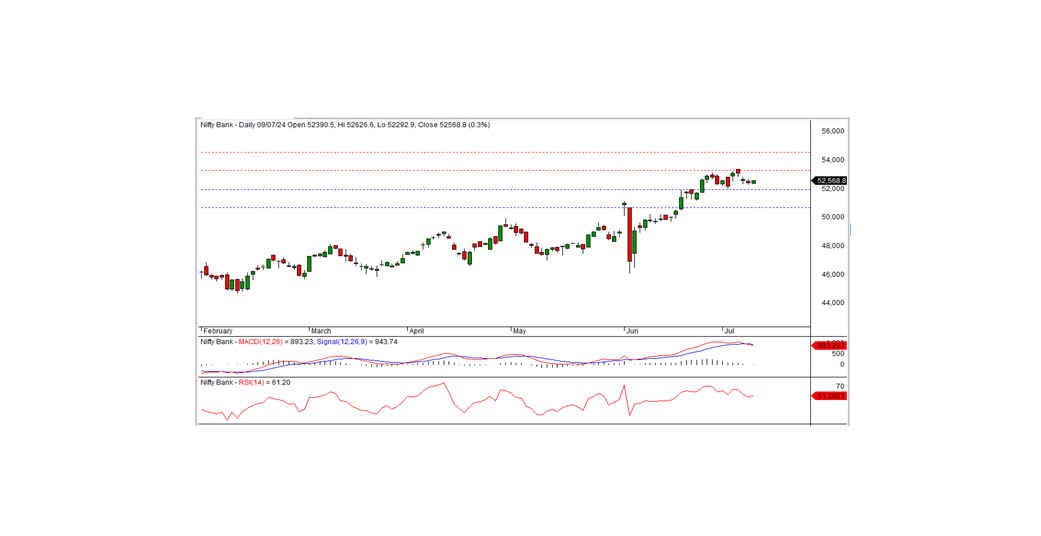
BANK NIFTY
In the preceding trading session, Bank Nifty closed at 52,568.80, registering a gain of 143.00 points. Technically, the momentum indicators signal a neutral trend, and the index remains above the medium-term and long-term moving averages. Moreover, the index formed a small white candle on the daily chart and closed above the previous day's close. This pattern indicates a slightly positive bias for the index.
On the higher side, the index has intraday resistance at the 52,700 level. If the index moves above this level, the positive trend can continue in the coming days. Otherwise, the index may consolidate between the 51,900 and 52,700 levels for a few more days.
For intraday traders, the support levels are at 52,200, 51,900, and 51,600, while resistance levels can be identified at 52,700, 53,000, and 53,400, as indicated by the 15-minute charts.
Positional traders should monitor short-term support levels at 51,900-50,650, with resistance at 53,250-54,500.