NIFTY TECHNICAL OUTLOOK
Based on Market Closing on Monday, July 08, 2024
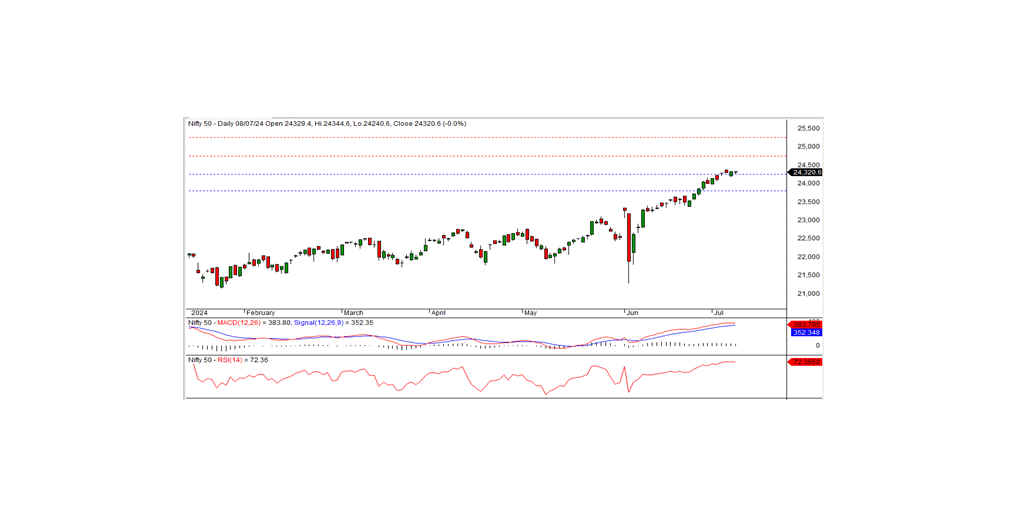
In the last trading session, the Nifty closed at 24,320.55, down 3.30 points or -0.01 percent. The index needs to surpass the intraday resistance level of 24,400 to establish a bullish trend.
In the last trading session, the Nifty opened at 24,329.40 with a negative bias and hit an intraday low of 24,240.60 in the morning trade. The index then gradually rose, testing an intraday high of 24,344.60, and finally closed at 24,320.55. All sectors, except FMCG and IT, closed with a negative bias. The major sector losers were PSU banks, metal, pharma, and auto. The market breadth was negative, with 1,024 stocks rising, 1,520 falling, and 91 remaining unchanged. The top gainers in the Nifty index were ONGC, ITC, HDFCLIFE, and HINDUNILVR, while the major losers included DIVISLAB, TITAN, BPCL, and SHRIRAMFIN.
From a technical standpoint, the momentum indicators signal a positive trend. The Nifty remains above both long-term and short-term moving averages. However, the index formed a Doji candle on the daily chart and closed just below the previous day's close. This pattern indicates the possibility of a consolidation. On the higher side, the index has short-term resistance at the 24,400 level. If the index trades and sustains above this level, the bullish trend can continue. Otherwise, the index may consolidate below this level for a few days. The nearest intraday support is at 24,300 levels.
Intraday Levels: Support: 24,300, 24,225, 24,150 Resistance: 24,400, 24,475-24,550 (15-Minute Charts)
Positional Trading: Short-term support: 24,250-23,800 Resistance: 24,750-25,250
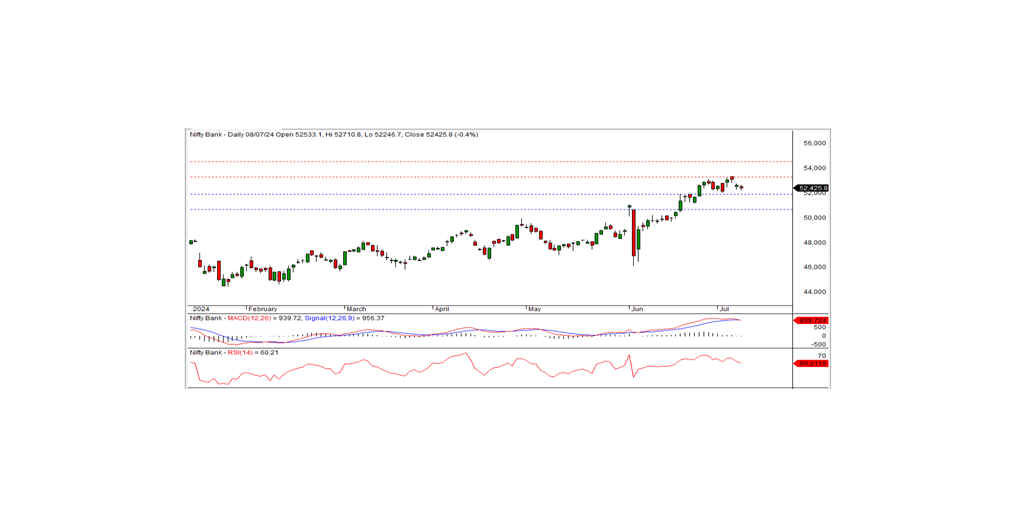
BANK NIFTY
In the preceding trading session, Bank Nifty closed at 52,425.80, registering a loss of 234.55 points. Technically, the MACD has given a sell signal on the daily chart. The index remains above the medium-term and long-term moving averages. However, it formed a black candle on the daily chart and closed below the previous day's close, indicating a slightly negative bias for the index.
On the lower side, the index has short-term support at the 51,900 level. If the index moves below this level, the downtrend may continue in the coming days. Otherwise, the index may consolidate above this level for a few more days. The nearest intraday resistance is at 52,700. For a bullish trend, the index needs to surpass this level.
Intraday Levels: Support: 52,200, 51,900, 51,600 Resistance: 52,700, 53,000, 53,400 (15-Minute Charts)
Positional Trading: Short-term support: 51,900-50,650 Resistance: 53,250-54,500