NIFTY TECHNICAL OUTLOOK
Based on Market Closing on Thursday, August 8, 2024
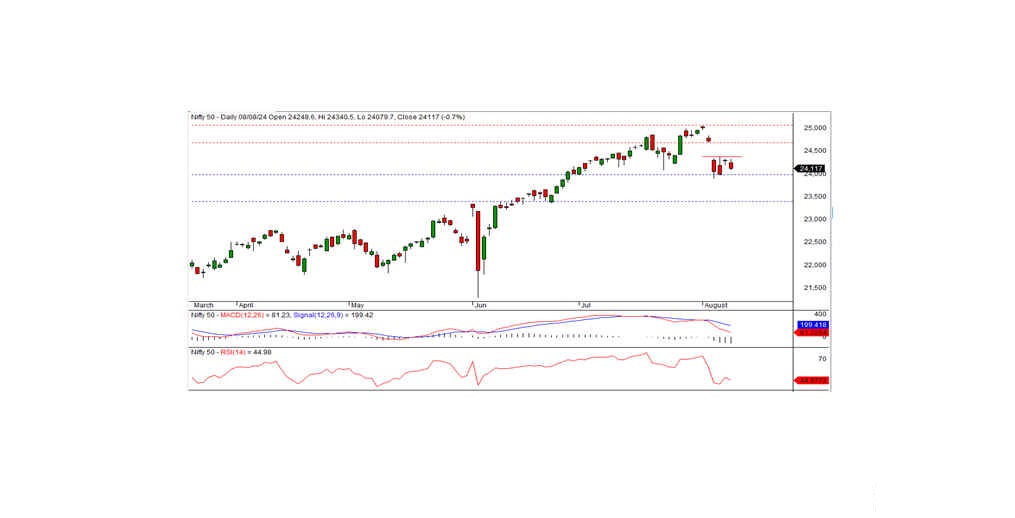
In the last trading session, the Nifty closed at 24,117.00, down by 180.50 points or -0.74%. The downtrend is expected to continue if the index falls below the intraday support level of 24,100.
The session began with a negative bias, opening at 24,248.60. The index tested an intraday high of 24,340.50 before moving downward, eventually hitting an intraday low of 24,079.70 and closing at 24,117.00. Sectors such as pharma, media, financial services, and private banks were the top gainers, while IT, metal, realty, and public sector banks were the biggest losers. The market breadth was negative, with 1,130 stocks rising, 1,452 falling, and 85 remaining unchanged. The top gainers in the Nifty index were HDFC Life, Tata Motors, SBI Life, and HDFC Bank, while the major losers included LTIM, Grasim, Asian Paints, and Infosys.
From a technical perspective, momentum indicators are signaling a negative trend, and the Nifty remains below its short-term moving averages. Additionally, the index formed a black candle on the daily chart and closed near the day's low, suggesting a continued negative bias. On the downside, the index has intraday support at the 24,100 level, with resistance at 24,350. A move below 24,100 is likely to extend the downtrend, while a move above 24,350 is needed for a pullback rally. Otherwise, the current consolidation may persist for a few more days.
Intraday Levels: Support: 24,100, 23,925, 23,800 Resistance: 24,350, 24,500-24,700 (15-Minute Charts)
Positional Trading: Short-term Support: 24,000-23,400 Resistance: 24,685-25,080
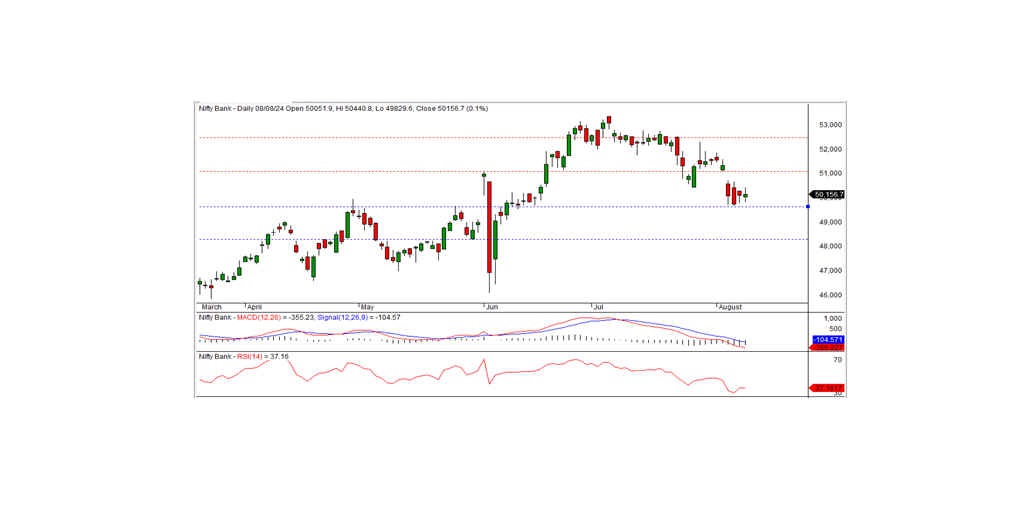
BANK NIFTY TECHNICAL OUTLOOK
In the preceding trading session, Bank Nifty closed at 50,156.70, registering a gain of 37.70 points. From a technical standpoint, momentum indicators suggest a downward trend, with the index remaining below its short-term moving averages. However, the index formed a small white candle on the daily chart and closed slightly above the previous day's close, indicating the potential for consolidation.
On the downside, the index has intraday support at the 50,000 level, while resistance is at 50,300. A move above the resistance level could signal a continuation of the positive trend, but if the index fails to breach this level, it may consolidate below it for a few days. Short-term support remains at the 49,600 level.
Intraday Levels: Support: 50,000, 49,800, 49,600 Resistance: 50,300, 50,600, 50,800 (15-Minute Charts)
Positional Trading: Short-term Support: 49,600-48,300 Resistance: 51,000-52,450