NIFTY TECHNICAL OUTLOOK
Based on Market Closing on Wednesday, December 18, 2024
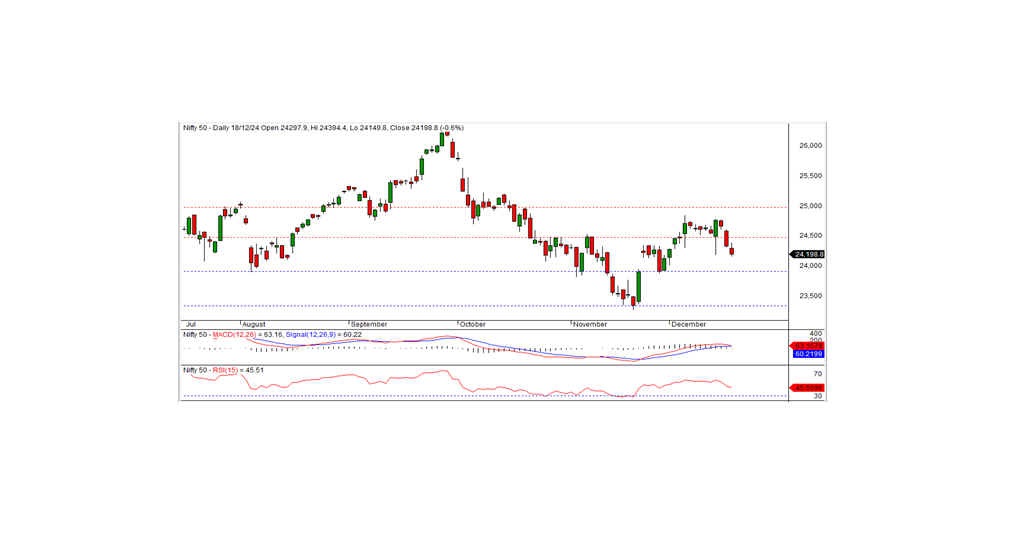
The Nifty closed at 24,198.85, down 137.15 points or 0.56%. A downtrend continuation is expected if the index breaches the critical support level of 24,150.
In the previous session, the Nifty opened negatively at 24,297.90 but managed to rise during the morning trade, testing an intraday high of 24,394.40. However, the index failed to sustain this momentum, gradually declining to an intraday low of 24,149.80 before closing at 24,198.85. All sectors, except pharma and IT, ended on a negative note. The biggest sectoral losers were media, banks, metals, and financial services.
Market breadth remained weak, with 768 stocks advancing, 1,958 declining, and 100 remaining unchanged. Key gainers in the Nifty included TRENT, DR REDDY, CIPLA, and WIPRO, while notable losers were TATAMOTORS, POWERGRID, BEL, and NTPC.
Technical Analysis
From a technical perspective, momentum indicators point to a negative bias, with the Nifty trading below its short-term moving averages. Additionally, the index formed a long black candle on the daily chart, closing below the prior session’s low. This pattern underscores the likelihood of a continued downtrend.
The Nifty’s failure to sustain upward momentum, coupled with a bearish candlestick pattern and negative sectoral performance, indicates the potential for further downside. Traders should closely monitor the 24,150 support level, as a breach could trigger an extended decline. Conversely, a move above 24,265 is crucial to revive bullish sentiment and stabilize market conditions.
Key Levels
Intraday Levels: Support: 24,150, 24,050, 23,950 Resistance: 24,265, 24,385-24,500 (15-minute charts) Positional Levels: Support: 23,800–23,300 Resistance: 24,500–25,000

BANK NIFTY TECHNICAL OUTLOOK
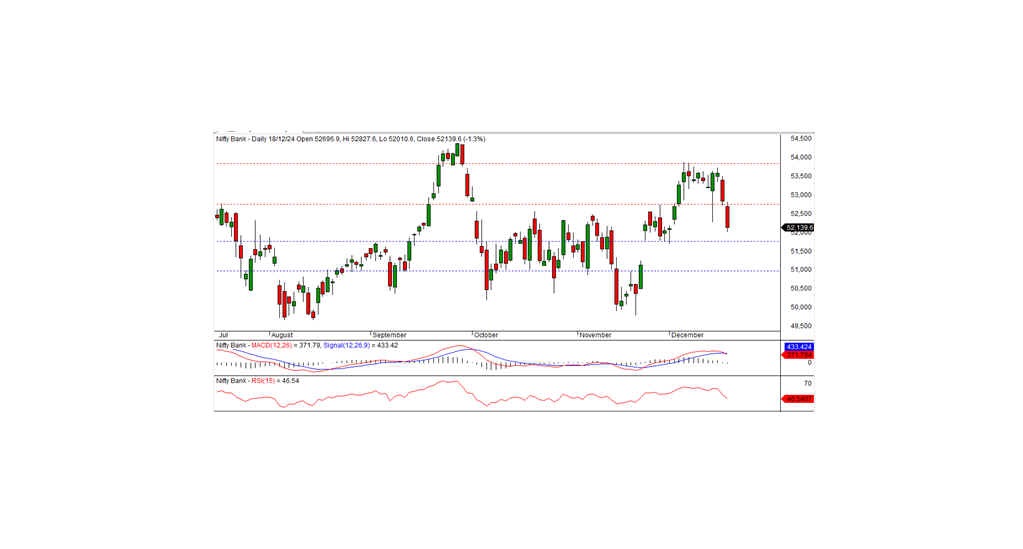
Bank Nifty ended the previous session at 52,139.55, reflecting a decline of 695.25 points or 1.32%. Technical indicators suggest a negative trend, with the index trading below its short-term moving averages. Additionally, a long black candle formed on the daily chart, signaling a strong bearish bias and closing well below the prior day’s levels.
On the upside, 52,750 serves as a key short-term resistance. A failure to breach this level may reinforce the ongoing downtrend. On the downside, the immediate intraday support is at 52,000, and a break below this level could accelerate further declines.
Key Levels for Traders
Intraday Levels (15-Minute Charts): Support: 52,000, 51,700, 51,400 Resistance: 52,350, 52,600, 52,850
Positional Levels: Support: 51,750–51,000 Resistance: 52,750–53,850
Bank Nifty remains under pressure, with bearish momentum reinforced by technical indicators and price action. The immediate levels of 52,000 on the downside and 52,750 on the upside will be crucial in determining the short-term trajectory. Traders should maintain caution, as a break below the key support could lead to deeper corrections in the coming sessions.

