Nifty Technical Outlook
Based on Market Closing on Tuesday, November 19, 2024
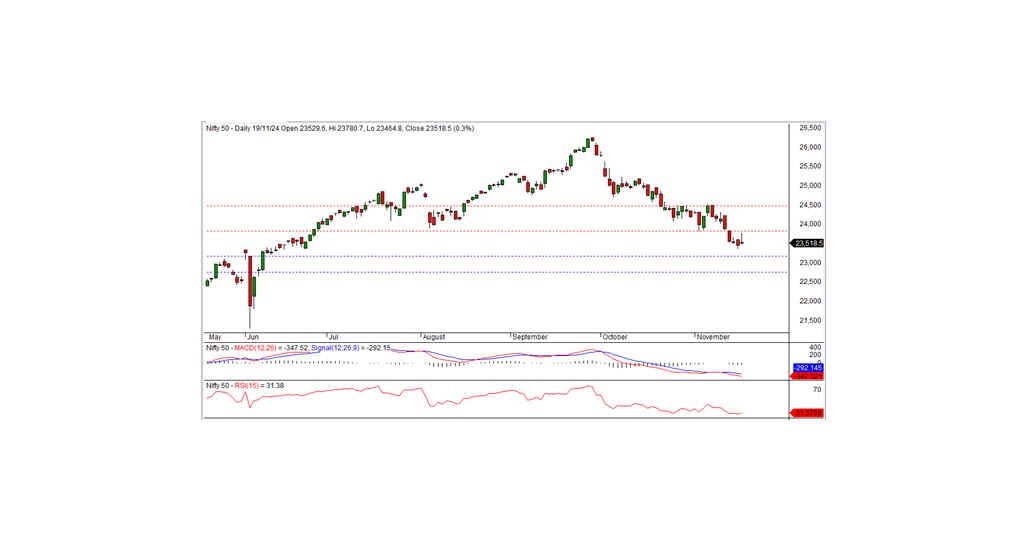
The Nifty closed at 23,518.50, gaining 64.70 points or 0.28%. To sustain the uptrend, the index needs to decisively break above 23,550.
In the previous session, the Nifty opened positively at 23,529.60, reaching an intraday high of 23,780.70 in the morning trade. However, the index witnessed sharp selling in the afternoon, hitting an intraday low of 23,464.80 before recovering slightly to close at 23,518.50.
Sector-wise, Media, Realty, Auto, and Pharma led the gains, while Metal and PSU Banks ended with a negative bias. The market breadth was positive, with 1,599 stocks advancing, 1,061 declining, and 119 remaining unchanged. Among the top Nifty gainers were M&M, Tech Mahindra, HDFC Bank, and Trent, while the key losers included SBI Life, Hindalco, Reliance, and Tata Consumer.
Technical Analysis
Momentum indicators continue to reflect a negative trend, as the Nifty trades below its long-term and medium-term moving averages. The index formed a black candle on the daily chart, closing within the previous session’s range, signaling potential consolidation. Intraday resistance is at 23,550. Sustaining above this level could extend the positive momentum, with further resistance at 23,650–23,780. Immediate intraday support lies at 23,425. If the index sustains below this level, the recent downtrend could resume, with the next significant short-term support at 23,150.
Intraday: Support: 23,425, 23,300, 23,200 Resistance: 23,550, 23,650–23,780
Positional: Support: 23,150–22,750 Resistance: 23,800–24,500

Bank Nifty Technical Outlook
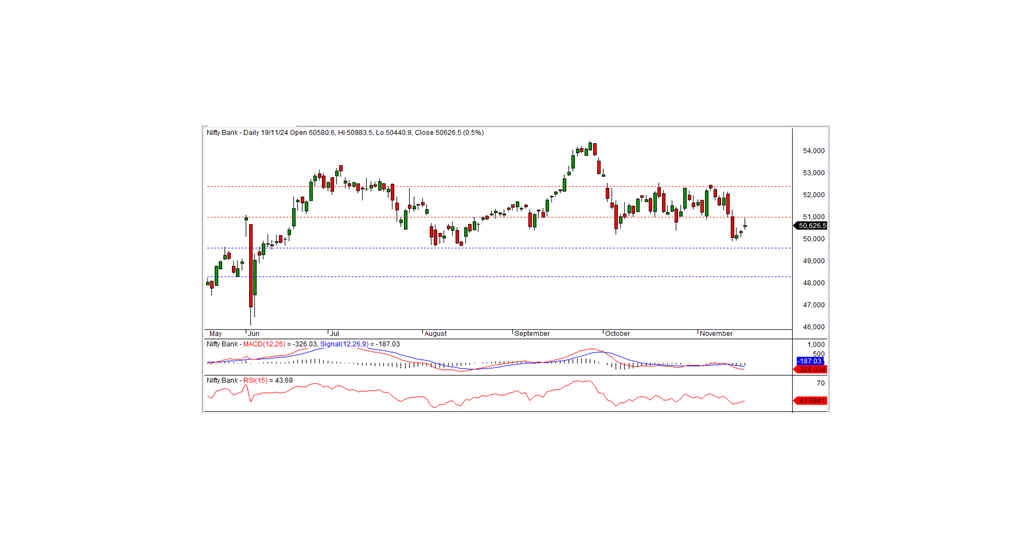
In the previous session, Bank Nifty closed at 50,626.50, gaining 262.70 points. Despite the recovery, momentum indicators still signal a negative trend, with the index trading below its short-term and medium-term moving averages. On the daily chart, the index formed a small white candle, closing above the prior session’s level. This suggests potential consolidation in the near term. Bank Nifty's immediate movement depends on whether it can breach the 50,700–51,000 resistance zone. A sustained move above 51,000 would indicate a shift in momentum, potentially driving further gains. Conversely, failing to cross this level may result in sideways consolidation or a retest of lower support levels. Positional traders should monitor the 49,600 support and the 51,000 resistance for broader market cues.
Intraday Levels (15-Minute Charts) Support: 50,430, 50,200, 50,000 Resistance: 50,700, 50,950, 51,200
Positional Levels Support: 49,600–48,300 Resistance: 51,000–52,400

