NIFTY TECHNICAL OUTLOOK
Based on Market Closing on Tuesday, October 08, 2024
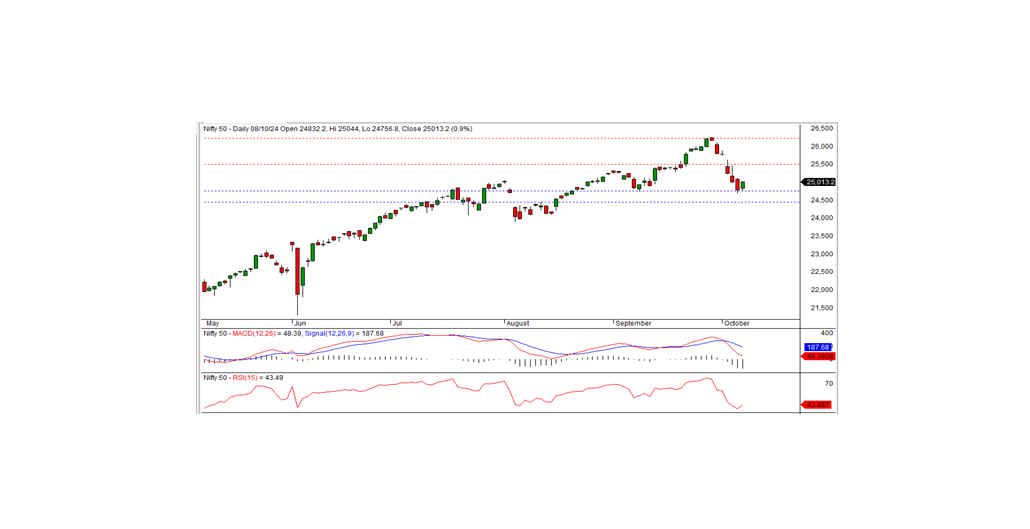
In the last trading session, the Nifty closed at 25,013.15, gaining 217.40 points or 0.88%. A positive bias is expected to continue if the index remains above the key intraday support level of 25,000.
Nifty opened with a positive bias at 24,832.20, climbed to an intraday high of 25,044.00, and finally closed at 25,013.15. Most sectors, except metals, closed on a positive note. The biggest sector losers were media, auto, pharma, and banks. Market breadth remained positive, with 2,082 stocks rising, 584 declining, and 75 remaining unchanged. Top gainers under the nifty included TRENT, BEL, ADANIENT, and ADANI PORTS, while SBILIFE, TATASTEEL, TITAN, and BAJAJFINSV were the biggest losers.
Technically, momentum indicators continue to reflect a negative trend as the Nifty remains below its short-term moving averages. However, on the daily chart, the index formed a Bullish Harami pattern, signaling a potential reversal of the bearish trend. For confirmation, the index must trade and sustain above the high of the Harami pattern in the coming sessions.
On the downside, the 25,000 level acts as intraday support. If the index stays above this mark, the positive trend could extend today. The nearest intraday resistance is seen at 25,125.
Intraday Levels: Support: 25,000, 24,900, 24,800 Resistance: 25,125, 25,225, 25,340 (15-Minute Charts)
Positional Trading Levels: Short-term support: 24,750, 24,450 Resistance: 25,500, 26,275
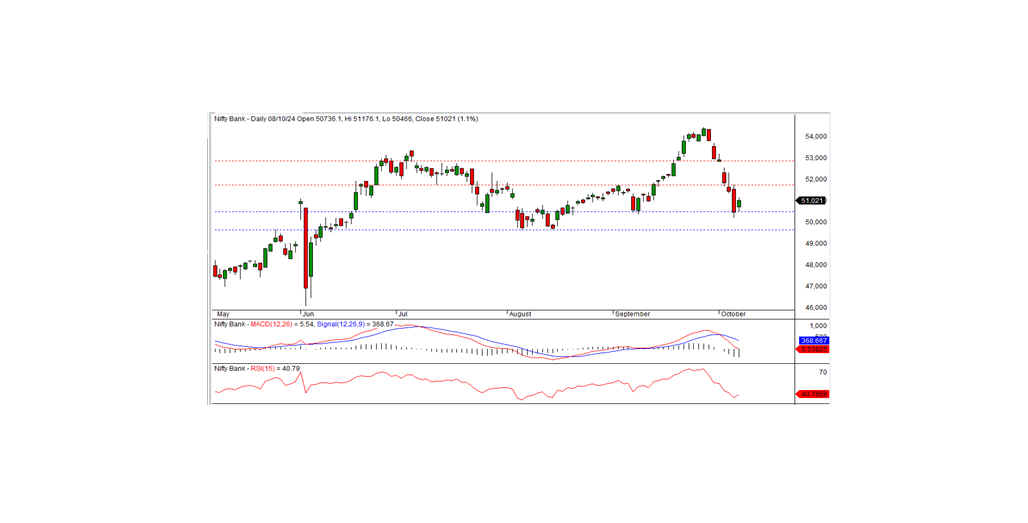
BANK NIFTY TECHNICAL OUTLOOK
In the last trading session, Bank Nifty closed at 51,021.00, recording a gain of 542.10 points. Technically, momentum indicators still point to a negative trend, as the index remains below its short-term moving averages. However, the formation of a white candle on the daily chart, which closed within the range of the previous day's black candle, suggests that the ongoing bearish trend is weakening. This pattern hints at a potential shift toward an upside movement.
On the downside, Bank Nifty has intraday support at the 51,000 level, while resistance lies at 51,215. To confirm a bullish continuation, the index must surpass the resistance at 51,215. Otherwise, it may consolidate below this level for a few days.
Intraday Levels: Support: 51,000, 50,650, 50,350 Resistance: 51,215, 51,500, 51,800 (15-Minute Charts)
Positional Trading Levels: Short-term support: 50,500–49,600 Resistance: 51,750–52,800