NIFTY TECHNICAL OUTLOOK
Based on Market Closing on Tuesday, June 11, 2024
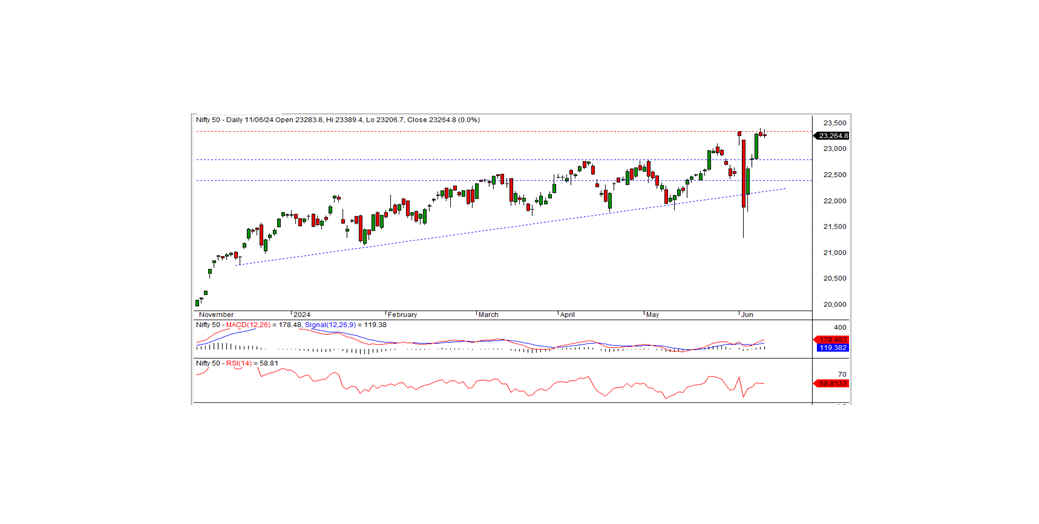
In the last trading session, the Nifty closed at 23,264.85, up 5.65 points or 0.02%. To continue the uptrend, the index must close above the short-term resistance area of 23,340 - 23,410.
The Nifty opened at 23,283.80 with a positive bias. Before moving further up, the index hit the intraday low of 23,206.70 in the morning trade. It then rose, tested the intraday high of 23,389.40, and finally closed at 23,264.85. The biggest gainers were the media, realty, auto, and PSU bank sectors, while the major losers were pharma, FMCG, private banks, and financial services. The market breadth was positive, with 1,568 stocks rising, 927 falling, and 119 remaining unchanged. The top gainers under the Nifty were ONGC, LT, Adani Ports, and Tata Motors, while the major losers included Kotak Bank, Divis Lab, Asian Paints, and Dr. Reddy's.
From a technical standpoint, the momentum indicators signal a positive trend. The Nifty remains above the long-term and short-term moving averages. The index formed the second consecutive small black candle on the daily chart and closed just above the previous day's close. This pattern indicates the possibility of consolidation. On the higher side, the index has resistance at the 23,340 - 23,410 levels. To continue the bullish trend, the index needs to close above these levels; otherwise, it may consolidate below this level for a few days. The nearest intraday support is at 23,200.
Intraday Levels: Support: 23,200, 23,000, 22,850 Resistance: 23,410, 23,550 - 23,700 (15-Minute Charts)
Positional Trading: Short-term support: 22,800 - 22,400 Resistance: 23,340 - 23,800
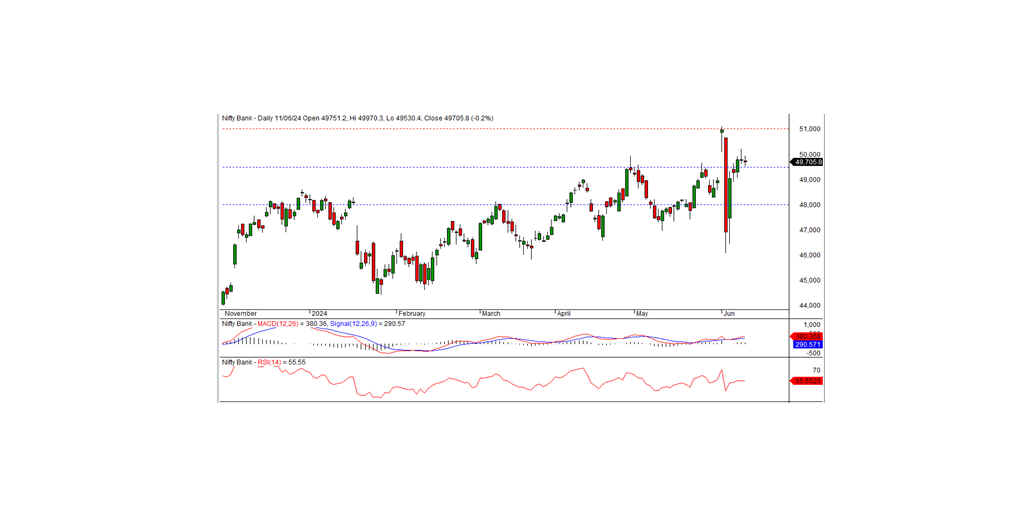
BANK NIFTY TECHNICAL OUTLOOK
In the preceding trading session, Bank Nifty closed at 49,705.75, registering a loss of 75.15 points. Technically, the momentum indicators signal a positive trend, and the index remains above the medium-term and short-term moving averages. However, the index formed a Doji candle on the daily chart and closed just below the previous day's close, indicating the possibility of consolidation.
Short-term support for the index lies at 49,500. If the index remains above this level, the consolidation may continue for a few more days. The nearest intraday resistance is at 50,100. To resume the uptrend, the index needs to surpass this level.
Intraday Levels: Support: 49,600, 49,100, 48,655 Resistance: 50,100, 50,500, 50,900 (15-Minute Charts)
Positional Trading: Short-term support: 49,500 - 48,000 Resistance: 51,000 - 52,300