NIFTY TECHNICAL ANALYSIS
Based on Market Closing on Wednesday, April 10, 2024
In the latest trading session, the Nifty reached a record high, closing at 22753.80, marking a gain of 111.05 points or 0.49 percent. The bullish momentum is expected to persist as long as the Nifty maintains levels above 22680.
The Nifty opened positively at 22720.30 and soared to a record peak of 22775.70 before settling at 22753.80. Most sectors closed in the green, with notable gains in the Media, PSU banks, FMCG, and metal sectors. However, the pharma and auto sectors ended on a slightly negative note. The market breadth trended towards negativity, with 1198 stocks rising, 1228 falling, and 171 unchanged. Top performers within the Nifty included COAL INDIA, BPCL, KOTAKBANK, and ITC, while HDFCLIFE, CIPLA, DIVISLAB, and MARUTI were among the significant decliners.
From a technical perspective, the Nifty remains above both short-term and long-term moving averages, with momentum indicators signaling a positive trajectory. The daily chart shows a white candle and closed above the previous day's close indicating a positive momentum. Intraday support is anticipated at around 22680, and sustaining above this level could lead to a further uptrend.
Key Intraday Levels: Support - 22680, 22620, 22550 Resistance - 22775, 22850, 22925 (Based on 15-Minute Charts)
For Positional Trading: Short-term support - 22500-21850 Resistance - 23000-23500.

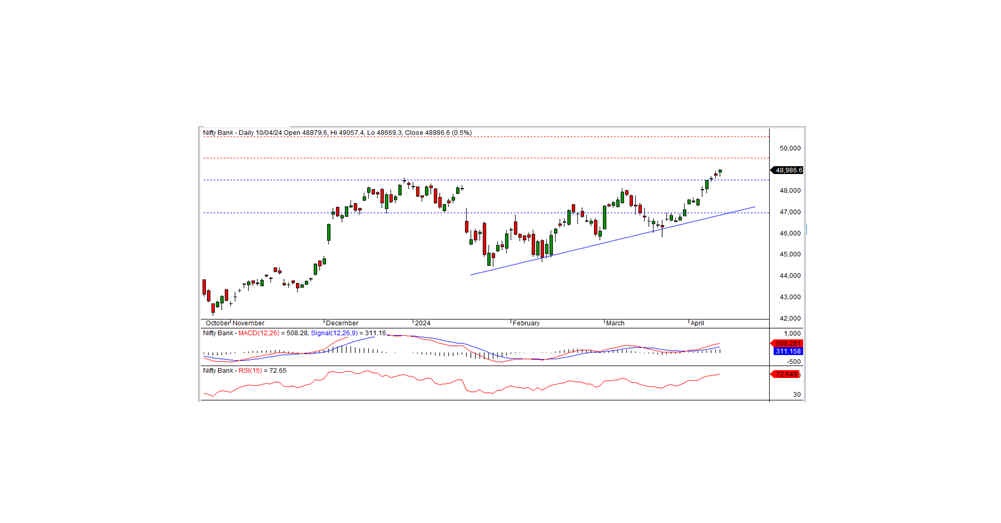
BANK NIFTY OUTLOOK
In the previous trading session, Bank Nifty achieved a record high, closing at 48986.60, marking a significant gain of 256.05 points. Technical indicators signal a positive momentum, with the index positioned above both short-term and long-term moving averages. Furthermore, the formation of a white candle on the daily chart, ending in a new high, underscores the potential for a sustained uptrend.
Looking ahead, intraday resistance is anticipated around 49050. A breakthrough above this level could pave the way for further bullish momentum in the coming days, with the next short-term resistance at the 49500 level.
For intraday traders, key support levels are identified at 48000, 48600, and 48400, while resistance levels are poised at 49050, 49250, and 49450, as per insights from the 15-minute charts.
Positional traders are advised to monitor short-term support levels at 48500-47000, with resistance noted at 49500-50500. These levels can provide valuable guidance for strategic decision-making amidst market fluctuations.