NIFTY TECHNICAL ANALYSIS
Based on Market Closing on Tuesday, April 02, 2024
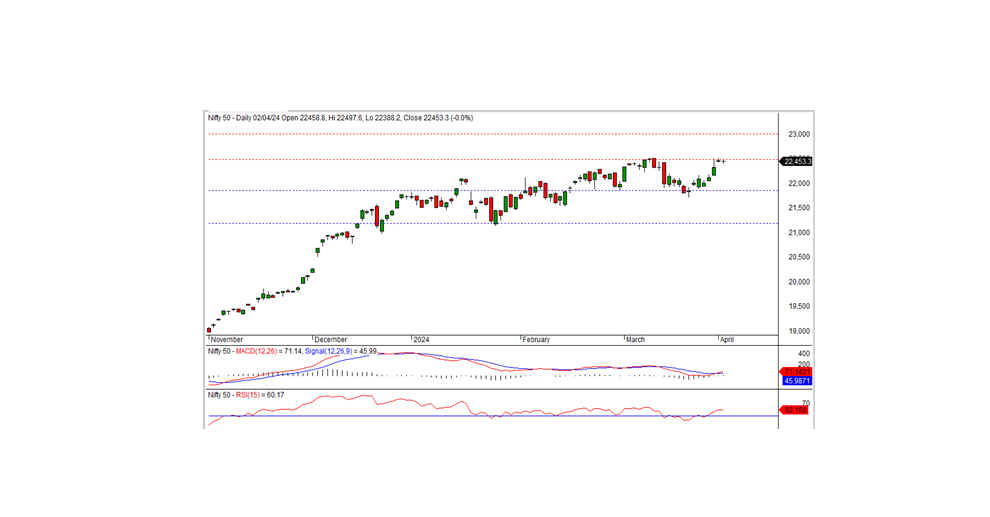
In the most recent trading session, the Nifty concluded at 22,453.30, experiencing a marginal decline of -8.70 points or -0.04 percent. To confirm an uptrend, the Nifty must surpass the resistance level of 22,500.
Nifty opened at 22,458.80 and reached an intraday high of 22,497.60 before gradually declining to touch an intraday low of 22,388.20, eventually, closing at 22,453.30. Media, metal, auto, and realty sectors exhibited notable gains, while IT, financial services, pharma, and private banks encountered significant losses. The market breadth leaned towards positivity, with 1,883 stocks advancing, 588 declining, and 101 remaining unchanged. Top gainers within the Nifty included TATACONSUM, M&M, BAJAJ-AUTO, and BPCL, whereas major losers encompassed HEROMOTOCO, KOTAKBANK, HCLTECH, and ICICIBANK.
From a technical perspective, the Nifty sustains its position above both short-term and long-term moving averages. Momentum indicators suggest a favorable trend. Markedly, the index formed a second consecutive Doji candle on the daily chart, closing near the short-term resistance of 22,500, suggesting an uptrend might continue. The closing above the 22,500 level may indicate a robust positive trend in the coming sessions, while failure to do so could lead to a brief consolidation below this level. The nearest intraday support is seen at the 22,400 level.
Intraday Levels: Support - 22,400, 22,300, 22,200 Resistance - 22,500, 22,600, 22,700 (15-Minute Charts)
Positional Trading: Short-term Support - 21,850-21,200 Resistance - 22,500-23,000
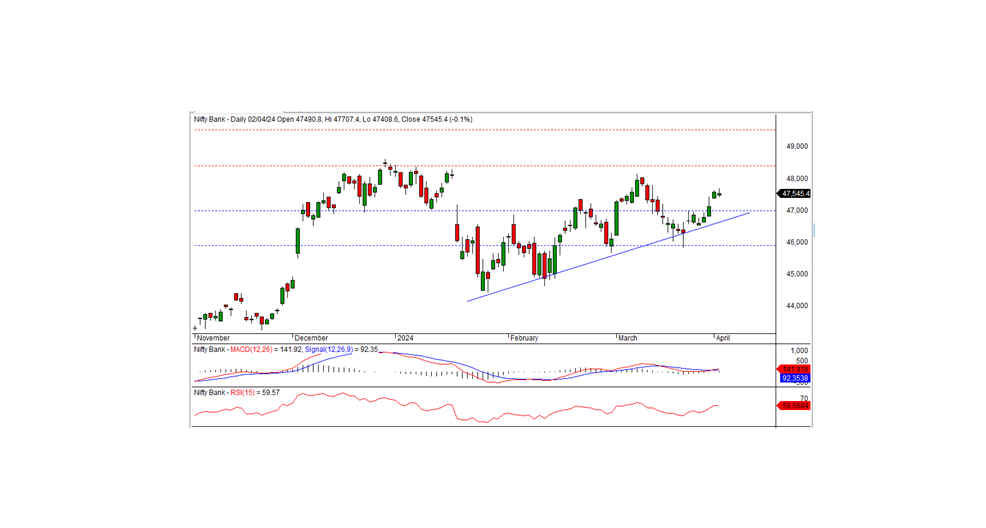
BANK NIFTY ANALYSIS
In the preceding trading session, Bank Nifty concluded at 47,545.45, depicting a loss of -32.80 points. Technically, momentum indicators signal a positive trend, and the index remains positioned above both short-term and long-term moving averages. A small white candle formation on the daily chart, closing within the preceding day's candle, suggests a potential consolidation phase. The nearest intraday resistance is identified at 47,700, with support persisting at 47,450. A movement above 47,700 is imperative for a favorable trend, otherwise, consolidation may persist for a few days.
For Intraday Traders: Support Levels - 47,450, 47,250, 47,000 Resistance Levels - 47,700, 47,900, 48,100 (15-Minute Charts)
For Positional Traders: Monitor short-term support levels within the range of 47,000-46,000, with resistance observed at 48,500 -49,500.