NIFTY TECHNICAL OUTLOOK
As of the market close on Friday, February 2, 2024
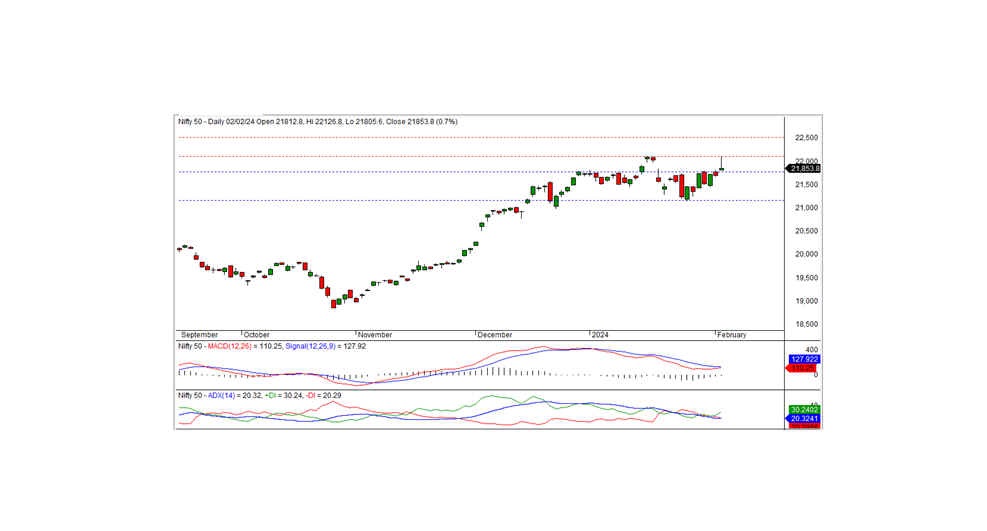
The Nifty ended the session at 21853.80, marking a gain of 156.35 points or 0.72 percent. Sustaining above 21750 indicates a positive trend.
Opening at 21812.80 with a positive gap, the Nifty reached a record high of 22126.80 before losing momentum. It eventually dropped to an intraday low of 21805.60, closing at 21853.80. Sector gainers included metals, PSU banks, IT, and realty, while banks, financial services, and FMCG saw declines. Market breadth was positive, with 1212 stocks rising, 1185 falling, and 129 unchanged. Top gainers beneath the Nifty were BPCL, POWERGRID, ONGC, and ADANIPORTS, while major losers included EICHERMOT, AXISBANK, HDFCLIFE, and HDFCBANK.
Technically, the Nifty remains above short-term and long-term moving averages. Momentum indicators signal a neutral trend, though a shooting star pattern on the daily chart suggests a potential bearish reversal. This pattern's long upper shadow indicates selling pressure at resistance levels, with the index closing near its opening price. Confirmation of a bearish trend requires the next day's index to open with a downward gap or consistently trade below the shooting star candle. However, a rise in price post-shooting stars may indicate a false signal or highlight potential resistance around the candle's price range. Resistance at 22125 poses a challenge for upward movement, with bullish confirmation requiring a close above this level. A slightly negative trend might emerge if the Nifty falls below the 21800-21750 range.
Intraday Support levels: 21800-21700-21600 Resistance levels: 21900-22000-22125 (15 Minute Charts)
For positional traders, short-term support levels stand at 21750-21160, with resistance at 22125-22500.

BANK NIFTY
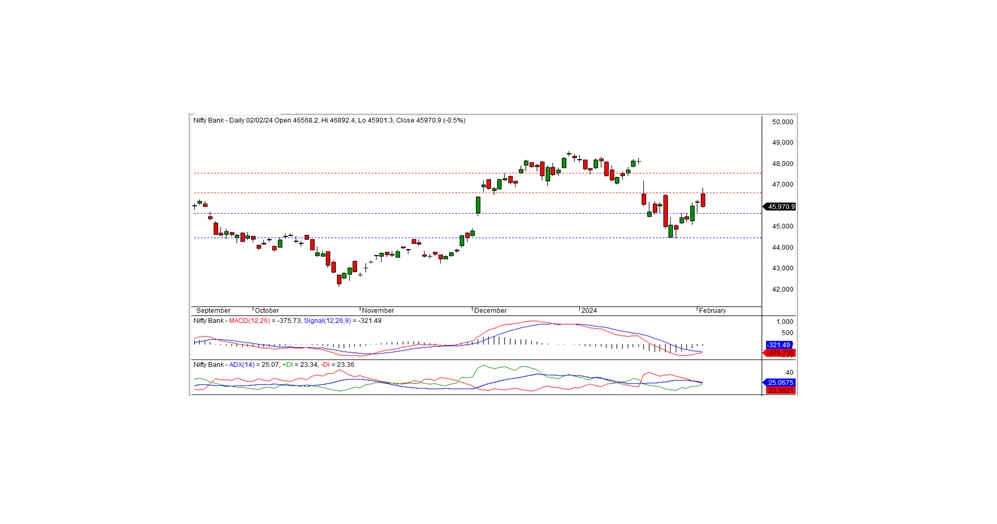
In the last trading session, Bank Nifty closed at 45970.95, marking a loss of 217.70 points. Technically, momentum indicators signal a negative trend, though the index remains above short-term moving averages. Additionally, a black candle formed on the daily chart, closing below the previous day's close. On the downside, intraday support rests at 45850. A move below this level could sustain the downtrend in the coming days. The closest intraday resistance stands at 46200, which the index needs to surpass for a potential pullback rally.
For intraday traders, support levels are at 45850, 45500, and 45200, while resistance levels can be identified at 46200, 46500, and 46800 according to 15-minute charts.
Positional traders should monitor short-term support levels at 45600-44450, with resistance at 46600-47550.

