NIFTY TECHNICAL UPDATE
As of the market close on Friday, January 5, 2024
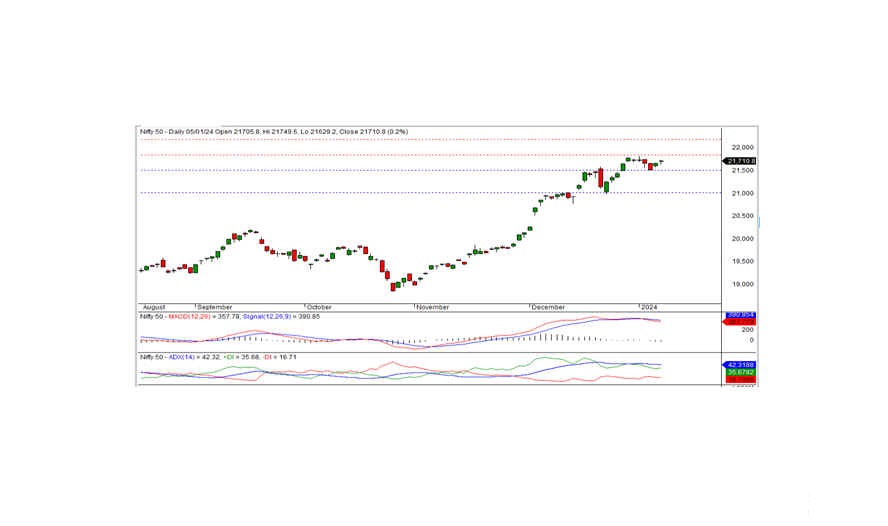
The Nifty concluded the trading session at 21,710.80, securing a gain of 52.20 points or 0.24 percent. A positive bias may persist if the Nifty surpasses the intraday resistance at 21,750.
Opening at 21,705.80 on a positive note, the Nifty reached an intraday high of 21,479.80 in the morning session. Subsequently, the index experienced a decline, touching the intraday low of 21,629.20, before ultimately closing at 21,710.80. Notably, the IT, auto, realty, and media sectors closed with a positive bias, whereas banks, pharma, metal, and FMCG were among the major losers. The market breadth exhibited positivity, with 1,306 stocks rising, 1,106 falling, and 98 remaining unchanged.
Top gainers under the Nifty include ADANI PORTS, TCS, LT, and SBILIFE, while the major losers were NESTLEIND, BRITANNIA, UPL, and SUN PHARMA.
From a technical standpoint, the Nifty continues to stay above the medium and long-term moving averages, with momentum indicators signaling a neutral trend. The daily chart reveals the formation of a Doji candle, closing above the previous day's close, suggesting a slightly positive bias. On the upside, the index faces intraday resistance at 21,750, and a breach of this level could lead to further upward movement. The nearest intraday support is at 21,685 levels.
Intraday Levels: Support: 21,685 - 21,525 - 21,565 Resistance: 21,750 - 21,800 - 21,850 (15 Minute Charts)
Positional Traders: For short-term positions, support levels remain at 21,500 - 21,000, with resistance at 21,835 - 22,200.

BANK NIFTY UPDATE
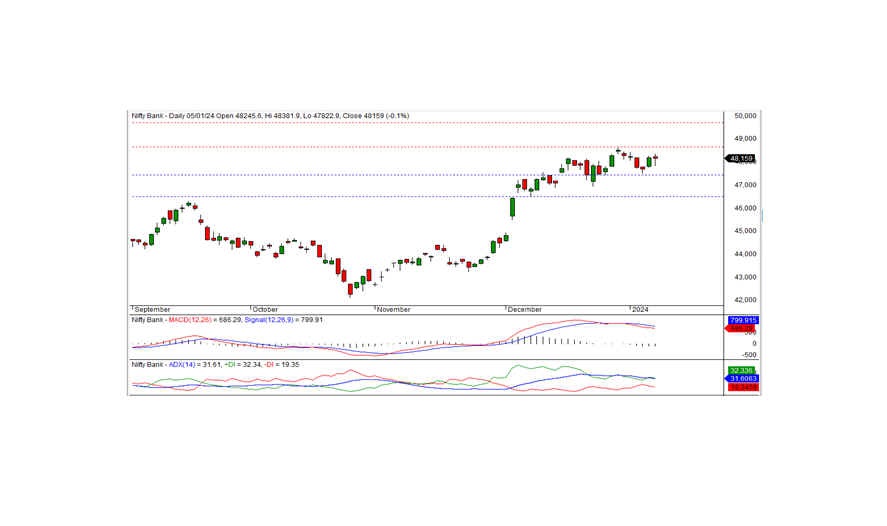
The recent trading session, Bank Nifty concluded at 48,159.00, reflecting a loss of -36.85 points. From a technical standpoint, momentum indicators suggest a neutral trend, yet the index remains above short-term moving averages. However, a black candle on the daily chart, closing below the previous day's close, indicates a potential consolidation phase.
On the upside, the index encounters intraday resistance at 48,300 levels. A move above this point is crucial for a positive trend. The closest intraday support lies at the 48,100 level, and a breach of this support may signal a slightly negative trend for the day.
Intraday Levels: Support: 48,100 - 47,900 - 47,700 Resistance: 48,300 - 48,450 - 48,600 (15 Minute Charts)
Positional Traders: For those in positional trades, it is advised to monitor short-term support levels at 47,400 - 46,500, with resistance at 48,650 - 49,700. Keep a close eye on these levels for potential shifts in the market dynamics.

