Nifty Technical Outlook
Based on Market Closing on Tuesday, July 16, 2024
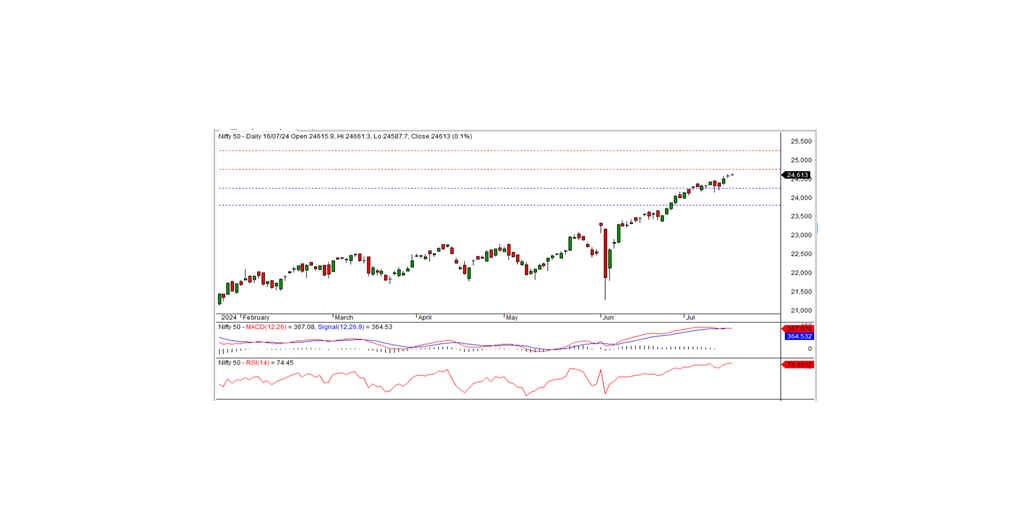
In the last trading session, the Nifty closed at 24,613, up 26.30 points or 0.11 percent. The positive trend will continue if the index remains above the intraday support level of 24,575.
The Nifty opened at 24,615.90 on a positive note and tested the record high of 24,661.30. However, it failed to maintain the momentum, gradually falling to an intraday low of 24,587.70 before closing at 24,613. The session saw mixed performances across sectors. Real estate, FMCG, IT, and auto sectors emerged as the top gainers, while media, pharma, PSU banks, and financial services were the top losers. The market breadth was negative, with 1,235 stocks rising, 1,337 falling, and 68 remaining unchanged. The top gainers in the Nifty index included COAL INDIA, BPCL, HINDUNILVR, and TATACONSUM, whereas the major losers were SHRIRAMFIN, DRREDDY, KOTAKBANK, and ULTRACEMCO.
From a technical standpoint, momentum indicators signal a positive trend, with the Nifty remaining above both long-term and short-term moving averages. The index formed a Doji candle on the daily chart and closed at a record high, suggesting a potential continuation of the bullish trend. The nearest intraday support is at 24,575 levels, and if the index remains above this level, the bullish trend is likely to persist in the coming days. On the higher side, the index faces intraday resistance at 24,660 levels.
For intraday levels, the support levels are at 24,575, 24,525, and 24,450, while the resistance levels are at 24,660 and 24,725-24,800 on the 15-minute charts.
For positional trading, the short-term support ranges from 24,250 to 23,800, with resistance from 24,750 to 25,250.
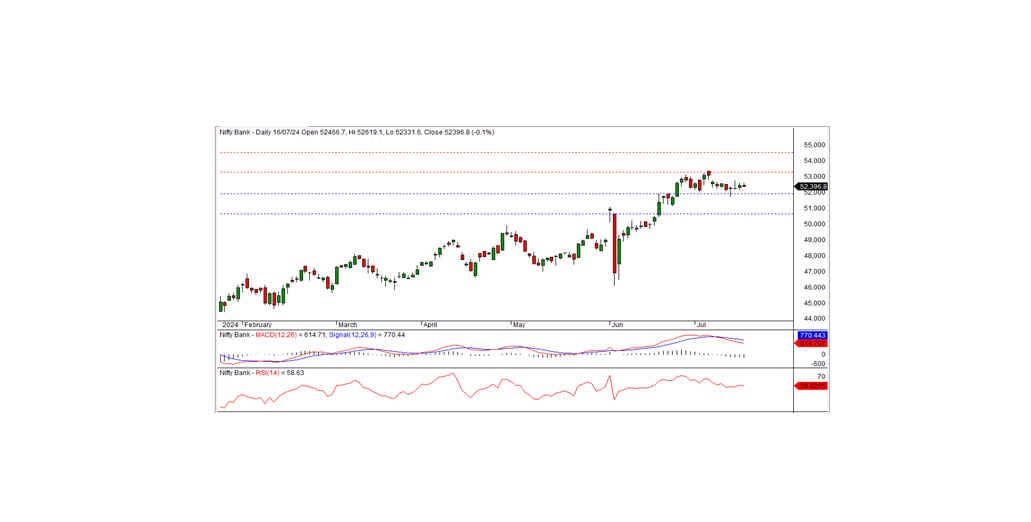
Bank Nifty
In the preceding trading session, Bank Nifty closed at 52,396.80, registering a loss of 59.10 points. Technically, the momentum indicators signal a negative trend. Although the index remains above the long-term and medium-term moving averages, it formed a small black candle on the daily chart and closed below the previous day's close. This pattern indicates a negative bias for the index.
On the higher side, the index faces intraday resistance at the 52,600 level. A positive trend can be expected if the index moves above this level; otherwise, it may continue the recent consolidation above the support level of 51,900 for a few more days. For intraday traders, the support levels are at 52,350, 52,100, and 51,900, while resistance levels can be identified at 52,600, 52,850, and 53,050 as indicated by the 15-minute charts.
Positional traders should monitor short-term support levels at 51,900-50,650, with resistance at 53,250-54,500.