NIFTY TECHNICAL OUTLOOK
Based on Market Closing on Tuesday, July 2, 2024
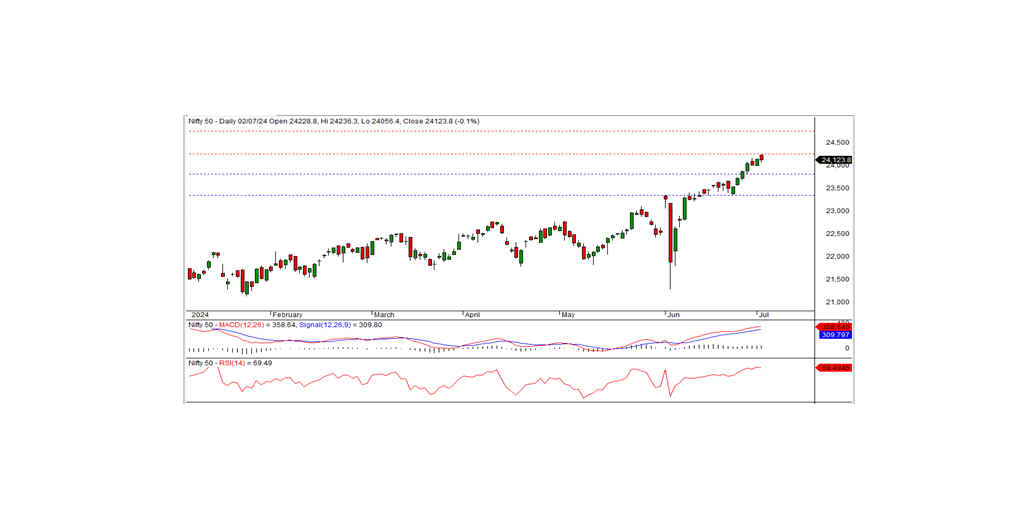
In the last trading session, the Nifty closed at 24,123.85, down 18.0 points or 0.07 percent. The index must trade and sustain above the 24,175 level to continue the bullish trend.
The Nifty opened at 24,228.80 on a positive note and tested a record high of 24,236.30. It then gradually declined, hitting an intraday low of 24,056.40 before closing at 24,123.85. The IT, media, realty, and pharma sectors were gainers, while banks, FMCG, and auto sectors were the major losers. Market breadth was positive, with 1,286 stocks rising, 1,273 falling, and 72 remaining unchanged. The top gainers in the Nifty index were LT, WIPRO, INFY, and HDFCBANK, while the major losers included SHRIRAMFIN, BHARTIARTL, KOTAKBANK, and TATAMOTORS.
From a technical standpoint, momentum indicators signal a positive trend. The Nifty remains above both long-term and short-term moving averages. However, the index formed a black candle on the daily chart and closed just below the previous day's close, indicating a slightly negative bias. On the higher side, the index has intraday resistance at the 24,175 level. If the index trades and sustains above this level, the bullish trend can continue. The nearest intraday support is at the 24,100 level.
Intraday Levels: Support: 24,100, 24,000, 23,900 Resistance: 24,175, 24,250-24,325 (15-Minute Charts)
Positional Trading: Short-term Support: 23,800-23,350 Resistance: 24,250-24,750
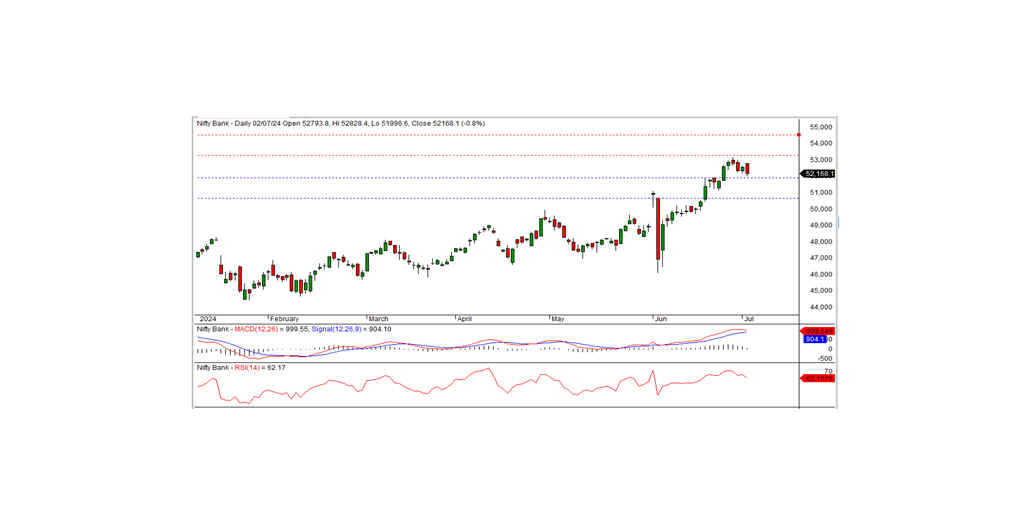
BANK NIFTY TECHNICAL OUTLOOK
In the preceding trading session, Bank Nifty closed at 52,168.10, registering a loss of 406.65 points. Technically, momentum indicators signal a positive trend, and the index remains above the medium-term and long-term moving averages. However, the index formed a black candle on the daily chart and closed below the previous day's close, indicating a slightly negative bias.
On the lower side, the index has short-term support at the 51,900 level. If the index closes below this level, the short-term trend may turn downward. Otherwise, a pullback rally can be expected from the support zone. The nearest intraday resistance is at the 52,250 level.
Intraday Levels: Support: 52,000, 51,750, 51,500 Resistance: 52,250, 52,550, 52,800 (15-Minute Charts)
Positional Trading: Short-term Support: 51,900-50,650 Resistance: 53,250-54,500