NIFTY TECHNICAL UPDATE
Based on the market close on Monday, December 18, 2023
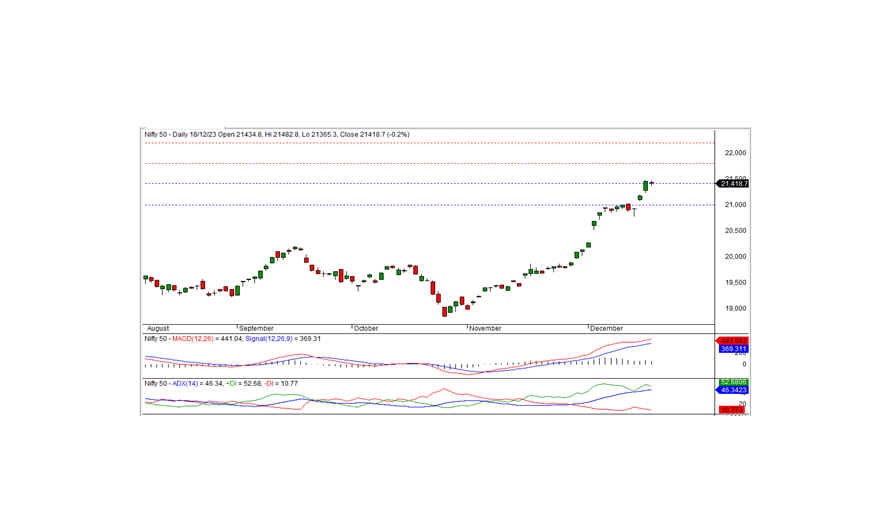
The Nifty concluded the trading session at 21,418.65, experiencing a loss of -38.00 points or -0.18 percent. To sustain the bullish momentum, the index must exceed the intraday resistance of 21,500.
Commencing at the 21,434.80 level, the Nifty opened on a negative note, reaching an intraday low of 21,365.30 in the morning trade. Subsequently, the index rebounded, testing the intraday high of 21,482.80, and ultimately closed at 21,418.65. Sectors such as media, pharma, metals, and auto demonstrated positive trends, while realty, banks, financial services, and FMCG faced losses. The market breadth reflected positivity, with 1,296 stocks rising, 1,070 falling, and 119 remaining unchanged. BAJAJ-AUTO, HINDALCO, ADANIPORTS, and SUNPHARMA emerged as top gainers, whereas POWERGRID, ICICIBANK, ITC, and JSWSTEEL recorded significant losses.
From a technical standpoint, the Nifty continues to remain above short-term and long-term moving averages, and momentum indicators signal a positive trend. However, the index formed a small black candle on the daily chart, closing within the previous day's close, suggesting a potential consolidation. On the downside, the index has intraday support at 21,400 levels. If the index drops below this level, a mildly negative trend may be anticipated today. The nearest intraday resistance is at 21,500, and surpassing this level is crucial to maintaining the bullish trend.
Intraday Support Levels: 21,400-21,300-21,200 Resistance Levels: 21,500-21,600-21,700 (15 Minute Charts)
For positional traders, short-term support levels persist at 21,400-21,000, with resistance at 21,800-22,200.

BANK NIFTY UPDATE
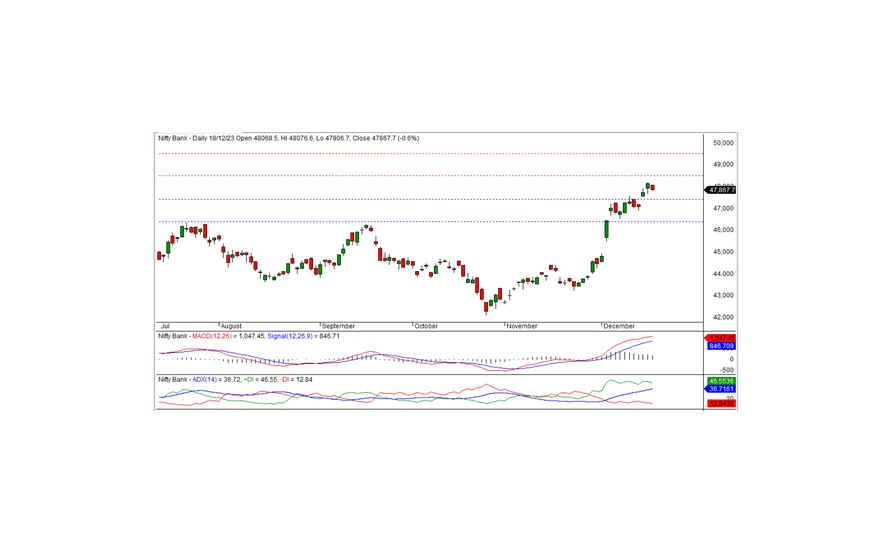
In the last trading session, Bank Nifty concluded at 47,867.70, marking a loss of -275.85 points. From a technical standpoint, momentum indicators signal a positive trend, and the index remains above both short-term and long-term moving averages. However, a black candle formed on the daily chart, closing below the previous day's close, indicating a slightly negative bias. On the downside, the index has intraday support at 47,850, and the continuation of this downtrend is possible if the index falls below this level. To initiate a pullback rally, the index must surpass the intraday resistance at 48,060.
For intraday traders, support levels are identified at 47,850, 47,640, and 47,450, while resistance levels can be observed at 48,060, 48,200, and 48,400, as indicated by the 15-minute charts.
Positional traders are advised to monitor short-term support levels at 47,400-46,400, with resistance located at 48,500-49,500.

