NIFTY TECHNICAL UPDATE
As of the market closing on Wednesday, December 13, 2023
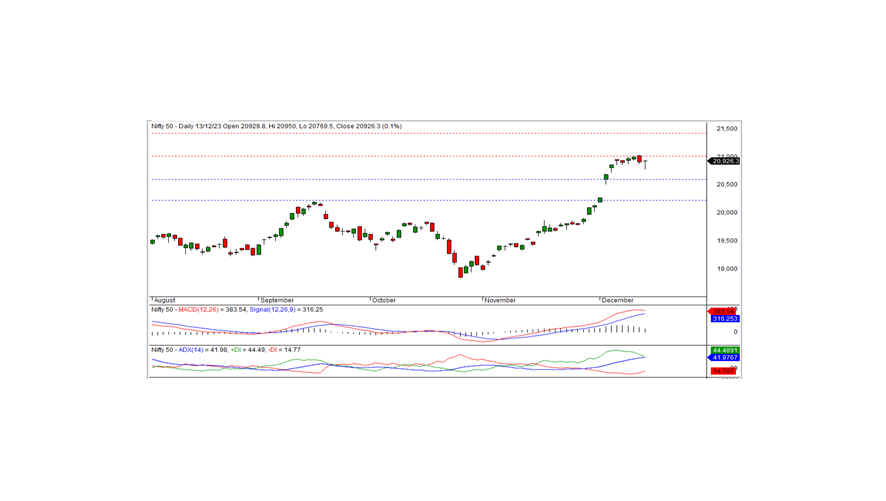
The Nifty concluded the trading session at 20926.35, registering a gain of 19.95 points or 0.10 percent. Despite encountering resistance at 21000, sustaining a bullish trend necessitates a close above this critical level.
Commencing at the 20929 level with a positive tone, the Nifty experienced a gradual decline, reaching an intraday low of 20769.50. However, during afternoon trading, the index rebounded, reaching an intraday high of 20950 before settling at 20926.35. Among sectors, realty, pharma, auto, and metal exhibited notable gains, while IT, banks, and financial services closed with a negative bias. The market breadth reflected positivity, with 1290 stocks advancing, 1060 declining, and 134 remaining unchanged. Noteworthy gainers beneath the Nifty include NTPC, HEROMOTOCO, POWERGRID, and ADANIPORTS, whereas TCS, INFY, AXISBANK, and BAJAJFINSV were the major losers.
From a technical standpoint, the Nifty maintains positions above both short-term and long-term moving averages, supported by positive signals from momentum indicators. However, a Doji candle formation on the daily chart, closing just above the previous day's close, suggests caution. The extended lower shadow of the candle indicates buying interest near the support zone. Looking ahead, the index faces resistance at the 21000 level, and a successful close above this mark could reignite bullish momentum. Conversely, profit booking may occur near this resistance level if it remains unbroken.
Intraday support levels stand at 20875-20820-20765, with resistance levels at 20950-21050-21100 based on 15-minute charts. For positional traders, short-term support levels persist at 20600-20200, while resistance is identified at 21000-21400.

BANK NIFTY UPDATE
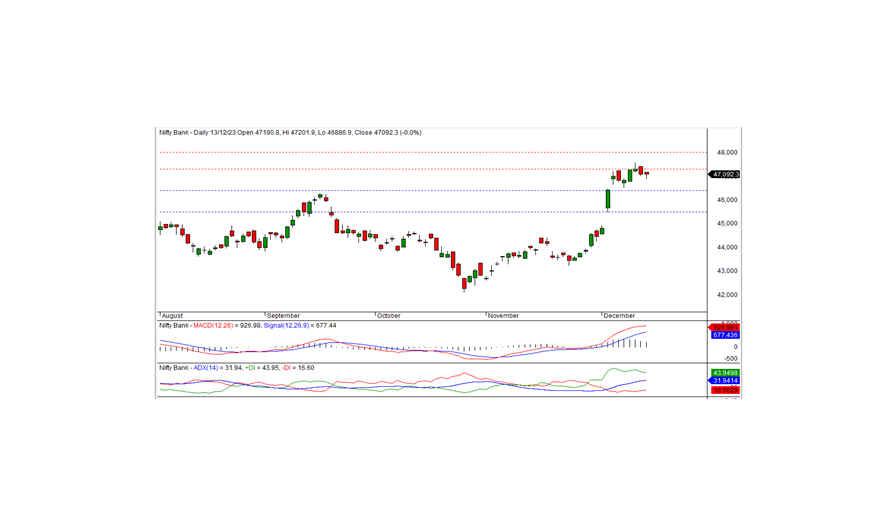
In the previous trading session, Bank Nifty concluded at 47092.25, reflecting a marginal loss of -5.30 points. From a technical standpoint, momentum indicators affirm a positive trend, and the index maintains positions above both short-term and long-term moving averages. However, a black candle formation on the daily chart, closing below the previous day's close, raises cautionary signals.
On the upside, the index encounters short-term resistance at 47300. A sustained trade below this level could extend the prevailing downtrend in the upcoming days, with the subsequent short-term support identified at 46400.
For intraday traders, crucial support levels include 46900, 46650, and 46400, while resistance levels are observed at 47150, 47400, and 47600, as depicted by the 15-minute charts.
Positional traders are advised to monitor short-term support levels at 46400-45500, with resistance levels noted at 47300-48000.

