NIFTY TECHNICAL OUTLOOK
Based on Market Closing on Tuesday, December 19, 2023
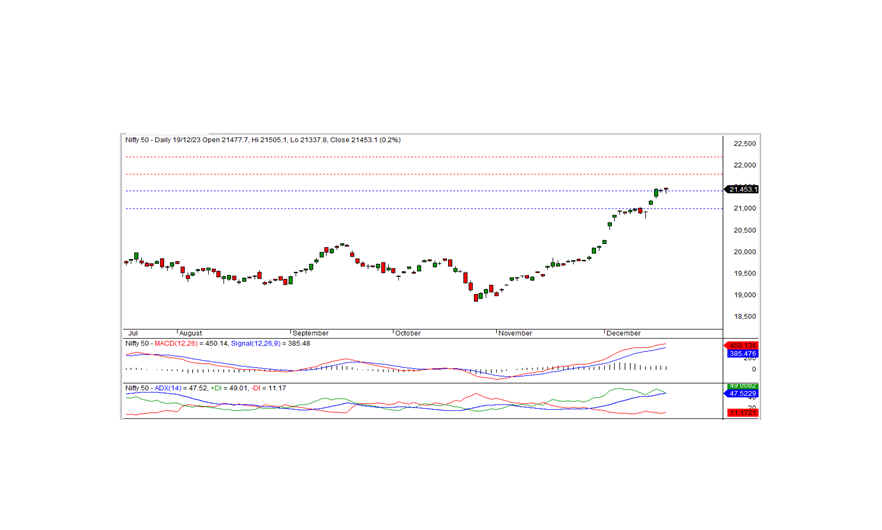
The Nifty concluded the trading session at 21,453.10, registering a gain of 34.45 points or 0.16 percent. To sustain the bullish momentum, the index needs to overcome the intraday resistance at 21,500.
The day commenced on a positive note as the Nifty opened at the 21,477.70 level. However, the momentum couldn't be sustained, leading to a dip in the index, reaching an intraday low of 21,337.80 in the morning trade. Subsequently, the index rebounded, testing the record high of 21,505.10 before closing at 21,453.10. Noteworthy gainers included FMCG, PSU banks, and pharma sectors, while IT, auto, media, and metal sectors experienced declines. The market breadth leaned negative, with 1,101 stocks rising, 1,239 falling, and 147 remaining unchanged.
Among the top gainers under the Nifty were COAL INDIA, NESTLEIND, NTPC, and TATACONSUM, while major losers included ADANI PORTS, HEROMOTOCO, SBILIFE, and WIPRO.
Technical Analysis: From a technical standpoint, the Nifty maintains its position above short-term and long-term moving averages, with momentum indicators signaling a positive trend. The daily chart revealed a Doji candle, closing above the previous day's close. The long lower shadow of the candle suggests that buying interest emerged near the support zone. On the upside, the index faces intraday resistance at 21,500 levels. A breach of this level could pave the way for the positive trend to continue in the coming days. The nearest intraday support is identified at 21,400 levels.
Intraday Levels: Support: 21,400 - 21,300 - 21,200 Resistance: 21,500 - 21,600 - 21,700 (15-Minute Charts)
Positional Trading: Support: 21,400 - 21,000 Resistance: 21,800 - 22,200

BANK NIFTY UPDATE
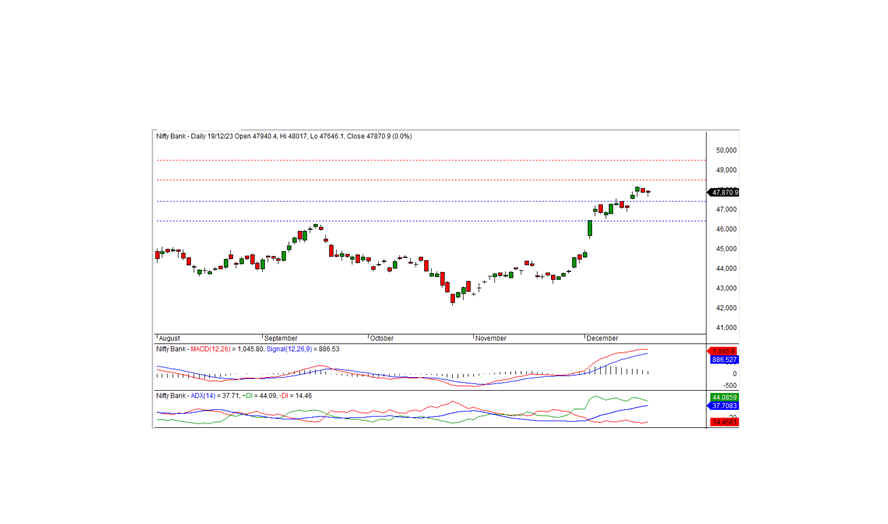
In the recent trading session, Bank Nifty concluded at 47,870.90, marking a modest gain of 3.20 points. From a technical standpoint, momentum indicators suggest a positive trend, and the index maintains its position above both short-term and long-term moving averages. However, the daily chart reveals a black candle, closing just above the previous day's close, indicating a potential consolidation phase.
On the downside, the index has intraday support at 47,850. If the index falls below this level, a slightly negative trend may unfold; otherwise, the index might consolidate above this support level. A potential pullback rally would require the index to breach the intraday resistance at 48,060.
For intraday traders, keeping an eye on support levels at 47,850, 47,640, and 47,450, with resistance identified at 48,060, 48,200, and 48,400, as per the 15-minute charts, is advisable.
Positional traders are recommended to monitor short-term support levels at 47,400-46,400, while potential resistance lies at 48,500 - 49,500.

