NIFTY TECHNICAL UPDATE
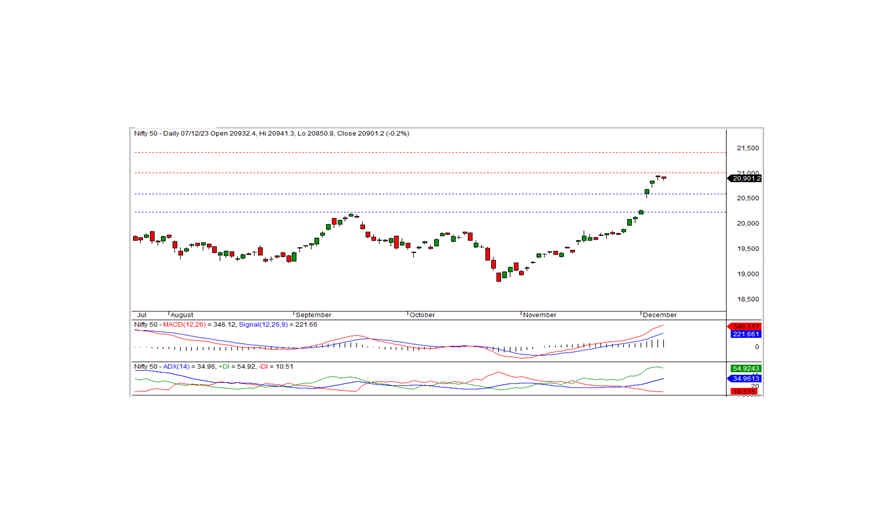
As of the market close on Thursday, December 7, 2023, the Nifty concluded the session at 20,901.15, experiencing a decline of -36.55 points or -0.17 percent. To sustain the prevailing bullish trend, the index must surpass the crucial resistance range of 20,962-21,000.
Commencing the day at 20,932.40 with a flat opening, the Nifty touched an intraday low of 20,850. Following this, it consolidated within the trading band of 20,850-20,941 before ultimately settling at 20,901.15. Noteworthy sector gainers included media, pharma, PSU banks, and auto, while FMCG, metal, IT, and private banks experienced losses. Market breadth reflected positivity, with 1,334 stocks advancing, 1,003 declining, and 144 remaining unchanged. Leading the gainers under the Nifty were POWERGRID, ADANI PORTS, ULTRACEMCO, and CIPLA, while BHARTIARTL, HINDUNILVR, ONGC, and APOLLOHOSP emerged as the major losers.
From a technical perspective, the Nifty maintains positions above both short-term and long-term moving averages, and momentum indicators signal a robust positive trend. However, the formation of a small black candle on the daily chart, coupled with a close below the previous day's ending, suggests a potential consolidation phase. Notably, resistance is observed at the 20,962-21,000 range. A breakthrough at this level could sustain the bullish momentum, whereas failure to do so might lead to a consolidation period.
Key Levels: Intraday Support: 20,850-20,735-20,640 Intraday Resistance: 20,962-21,060-21,150 (15-Minute Charts)
For Positional Traders: Short-Term Support: 20,600-20,200 Short-Term Resistance: 21,000-21,400

BANK NIFTY UPDATE
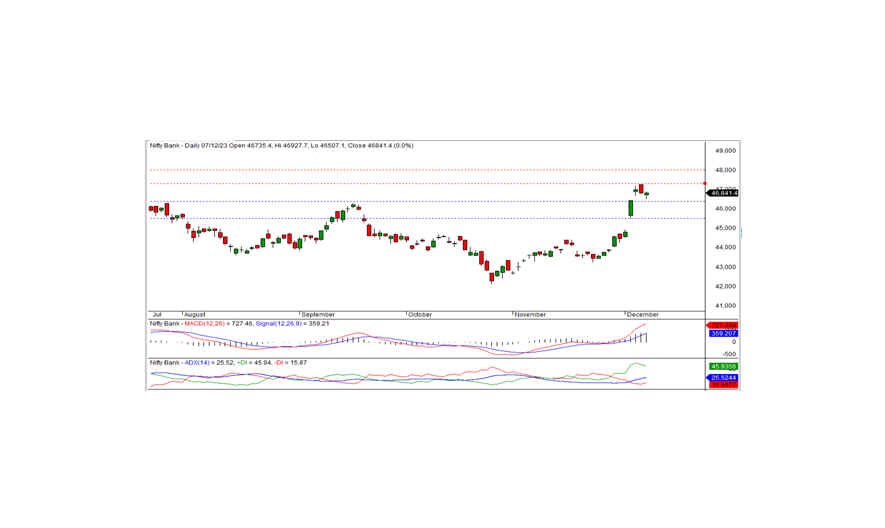
In the recent trading session, Bank Nifty concluded at 46,841.40, marking a modest gain of 6.85 points. Technically, momentum indicators affirm a positive trend, and the index maintains its position above both short-term and long-term moving averages. Additionally, the formation of a white candle on the daily chart, closing within the previous day's range, suggests a potential consolidation phase.
On the downside, intraday support is identified at the 46,500 level, while resistance is established at 46,940. A decisive breakout from either of these levels is crucial for the index to determine a clear direction.
Intraday Levels: Support: 46,500, 46,250, 46,000 Resistance: 46,940, 47,280, 47,550 (Based on 15-minute charts)
For Positional Traders: Short-Term Support: 46,400-45,500 Resistance: 47,300-48,000

