Nifty Technical Outlook
As of Market Closing on Thursday, September 19, 2024
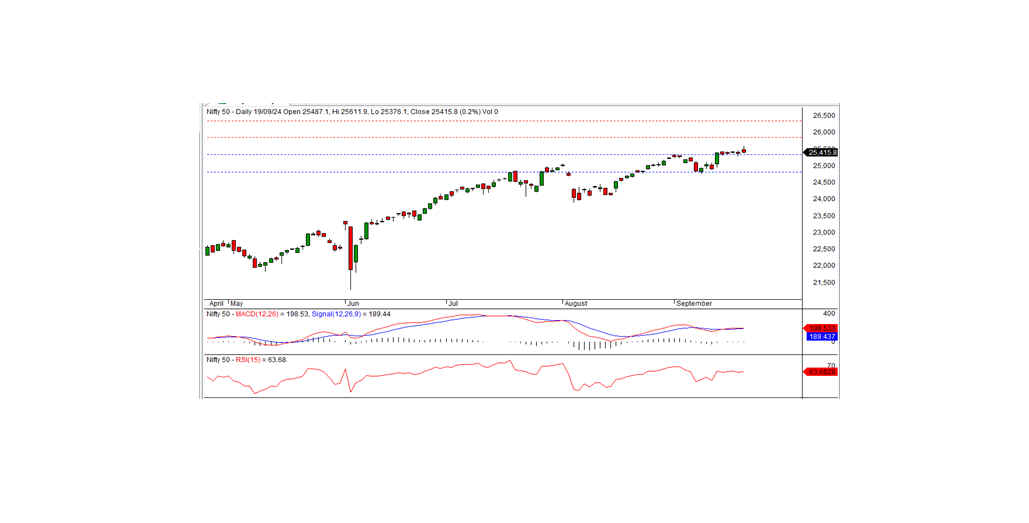
In the last trading session, the Nifty closed at 25,415.80, gaining 38.25 points or 0.15%. The bullish trend may persist if the index breaks through the intraday resistance level of 25,480.
The session opened with a positive bias at 25,487.10, and the index tested a new record high of 25,611.90. However, it was unable to maintain its momentum, gradually retreating to hit an intraday low of 25,376.10 before closing at 25,415.80. The FMCG, banking, real estate, and auto sectors led the gains, while media, private banks, metal, and pharma stocks underperformed. Market breadth was negative, with 666 stocks advancing, 1,957 declining, and 93 remaining unchanged. The top gainers in the Nifty were NTPC, Kotak Bank, Titan, and Nestlé India, while BPCL, Coal India, ONGC, and Adani Ports were among the major losers.
From a technical standpoint, momentum indicators continue to show a positive trend, with the Nifty trading above both short-term and long-term moving averages. However, the formation of a small black candle on the daily chart suggests the possibility of consolidation. The index closed marginally higher than the previous session, indicating a potential pause in the uptrend.
Key Levels to Watch: Immediate intraday support is at 25,400, with stronger support at 25,300. Intraday resistance is seen at 25,480. A breakout and sustained trade above this level are required to continue the bullish momentum. If the index stays below 25,480, consolidation may persist for a few more sessions. A move below 25,300 could signal a shift toward a negative bias.
Intraday Levels (15-Minute Charts): Support: 25,400, 25,300, 25,225 Resistance: 25,480, 25,550–25,600
Positional Trading: Support: 25,350–24,800 Resistance: 25,850–26,350

Bank Nifty Technical Outlook
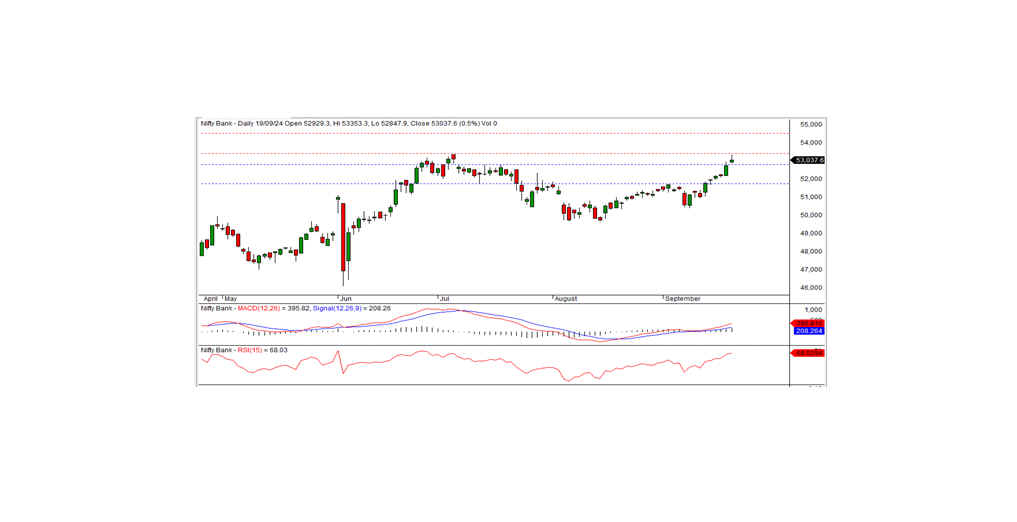
In the previous trading session, Bank Nifty closed at 53,037.60, up by 287.20 points. Technically, momentum indicators signal a positive trend, with the index trading above its short-term and long-term moving averages. The formation of a white candle on the daily chart, along with a close above the prior day's level, suggests the bullish momentum may continue. Bank Nifty continues to show strong bullish momentum, with the potential to extend gains. However, the index faces resistance at the 53,400 level. A close above this resistance is necessary to sustain the upward trend. If it fails to breach this level, consolidation below 53,400 could continue for a few days.
Intraday Levels (15-Minute Charts): Support: 52,900, 52,600, 52,400 Resistance: 53,175, 53,400, 53,600
Positional Trading: Support: 52,775–51,750 Resistance: 53,400–54,500

