Nifty Technical Outlook
Based on Market Closing on Tuesday, September 3, 2024
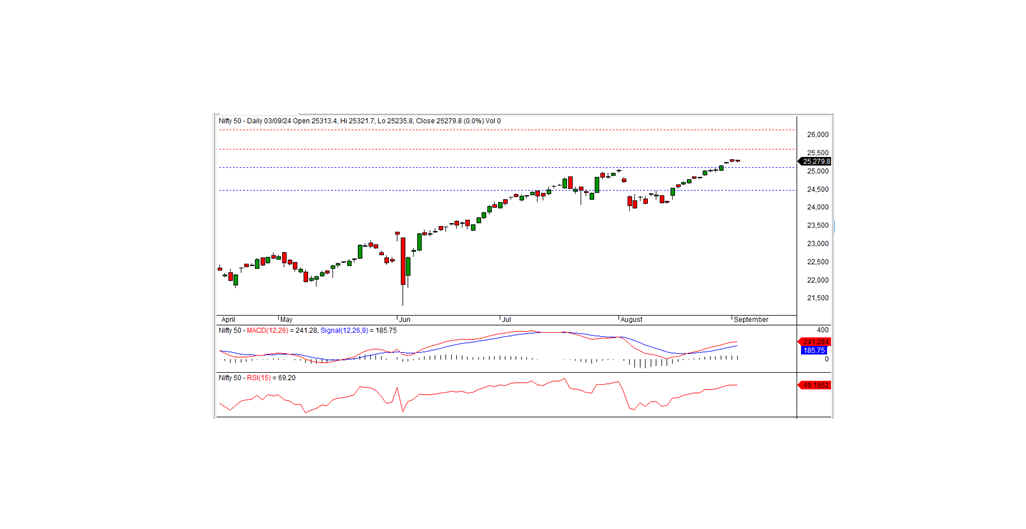
In the last trading session, the Nifty closed at 25,279.85, marking a modest gain of 1.15 points. To maintain its bullish trajectory, the index needs to break through the intraday resistance level of 25,350.
The session began with a positive bias at 25,313.40 and peaked at 25,321.70 in the morning. However, the index then declined, reaching an intraday low of 25,235.80 before ending the day at 25,279.85. The financial services, banking, and pharmaceutical sectors saw the most significant gains, while media, metal, and realty sectors faced declines. Market breadth was negative, with 1,277 stocks advancing, 1,300 declining, and 113 remaining unchanged. Notable gainers in the Nifty index included SBILIFE, HDFCLIFE, ICICIBANK, and SHRIRAMFIN, whereas ONGC, INFY, BAJFINANCE, and JSWSTEEL were among the major losers.
From a technical perspective, momentum indicators suggest a bullish trend as the Nifty remains above both short-term and long-term moving averages. The index formed a black candle on the daily chart, closing slightly above the previous day's close, which indicates potential consolidation. Support is noted at 25,250, with resistance at 25,350. To sustain the bullish trend, the index must break through the 25,350 resistance level. Failure to do so may result in consolidation below this level in the coming days.
Intraday Levels: Support: 25,250, 25,160, 25,080 Resistance: 25,350, 25,425-25,500 (15-Minute Charts)
Positional Trading: Short-term Support: 25,100 - 24,475 Resistance: 25,600 - 26,150
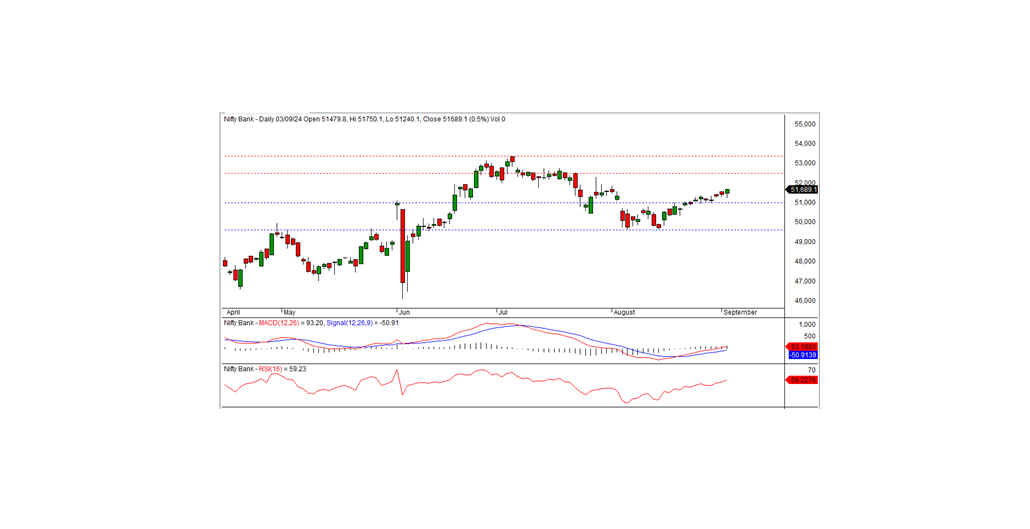
Bank Nifty Technical Outlook
Based on the Previous Trading Session
In the last trading session, the Bank Nifty closed at 51,689.10, marking a gain of 249.55 points. Momentum indicators currently point to a positive trend, as the index remains above both its short-term and long-term moving averages. Additionally, a white candle on the daily chart, closing above the previous day's level, suggests the potential for the bullish trend to continue.
On the upside, the index encounters intraday resistance at 51,750. If it trades above and sustains this level, the bullish momentum may persist in the coming days. The nearest intraday support is positioned at 51,600.
Intraday Levels: Support: 51,600, 51,450, 51,300 Resistance: 51,750, 51,900, 52,050 (15-Minute Charts)
Positional Trading: Short-term Support: 51,000 - 49,600 Resistance: 52,500 - 53,400