NIFTY TECHNICAL OUTLOOK
Based on Market Closing on Thursday, August 22, 2024
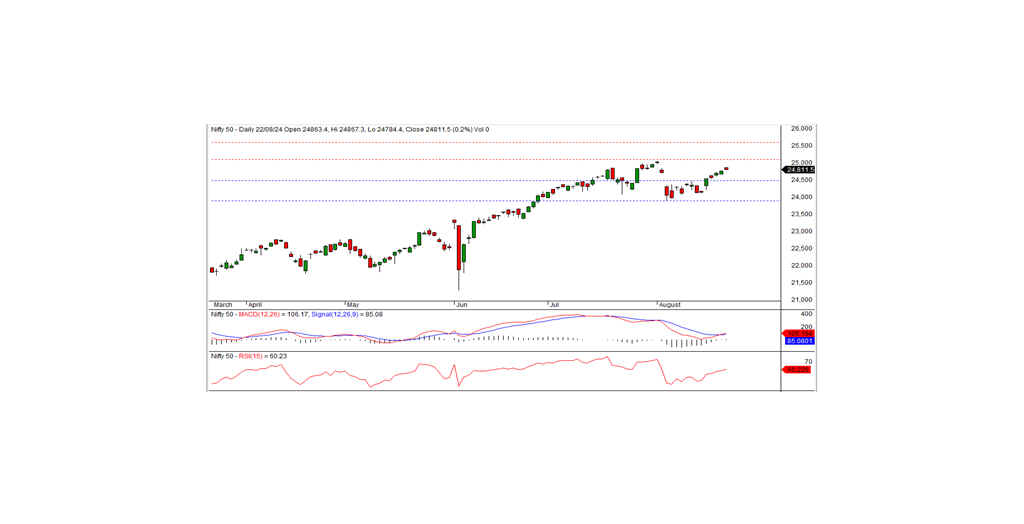
In the last trading session, the Nifty closed at 24,811.50, gaining 41.30 points or 0.17%. The positive trend is expected to continue if the Nifty moves above the intraday resistance level of 24,850.
The session began with a positive bias, at 24,863.40 and reached an intraday high of 24,867.30 during the morning trade. The index then traded within a narrow range and ultimately closed at 24,811.50. The biggest sector gainers were banks, metals, and FMCG, while the major losers were media, IT, pharma, and auto. The market breadth was positive, with 1,581 stocks rising, 926 falling, and 101 remaining unchanged. The top gainers in the Nifty index were GRASIM, TATACONSUM, BHARTIARTL, and TATASTEEL, while the major losers included TATAMOTORS, WIPRO, NTPC, and M&M.
Technically, momentum indicators signal a bullish trend, with the Nifty remaining above both its short-term and long-term moving averages. The index formed a small black candle on the daily chart but closed higher than the previous day's close, indicating the continuation of the upward trend. On the higher side, the index faces intraday resistance at the 24,850 level, and the bullish momentum is likely to persist if the index surpasses this level. The nearest intraday support is at 24,750.
Intraday Levels: Support: 24,750, 24,660, 24,580 Resistance: 24,850, 24,925-25,000 (15-Minute Charts)
Positional Trading: Short-term Support: 24,475-23,900 Resistance: 25,100-25,600
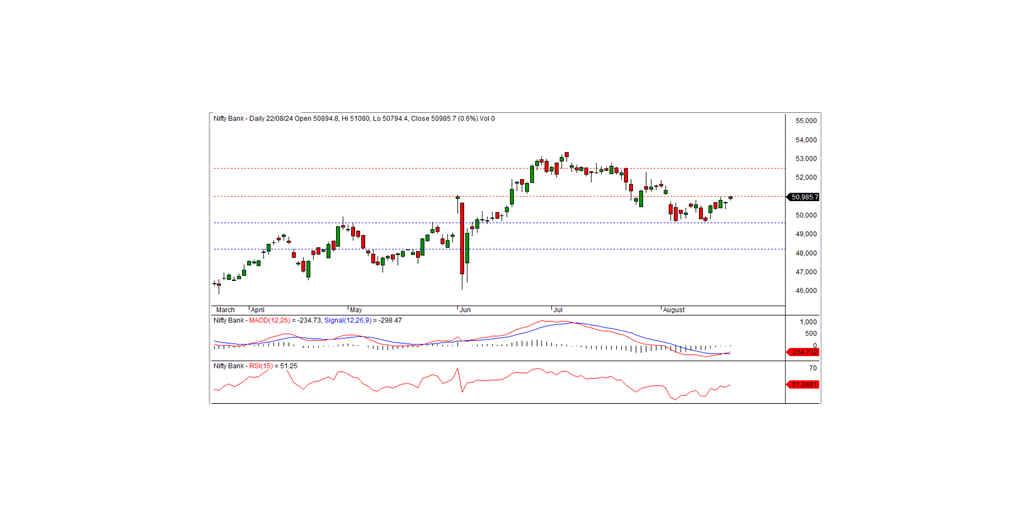
BANK NIFTY
In the previous trading session, Bank Nifty closed at 50,985.70, gaining 300.15 points. From a technical perspective, momentum indicators suggest a positive trend, with the index remaining above its short-term and long-term moving averages. Additionally, the index formed a white candle on the daily chart and closed near the day's high, indicating the potential for the uptrend to continue. On the upside, the index faces short-term resistance at the 51,000 level. If the index trades and sustains above this level, a further bullish trend can be expected in the coming days. The nearest intraday support is at the 50,875 level.
For intraday traders, support levels are at 50,875, 50,650, and 50,400, while resistance levels are identified at 51,075, 51,300, and 51,500, as indicated by the 15-minute charts.
Positional traders should monitor short-term support levels at 49,600-48,200, with resistance at 51,000-52,500.