NIFTY TECHNICAL OUTLOOK
Based on Market Closing on Tuesday, August 20, 2024
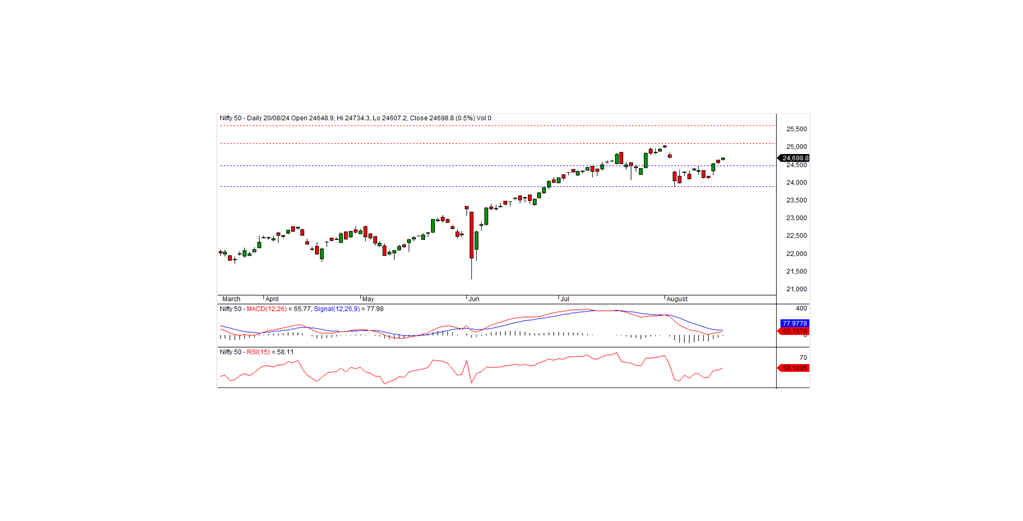
In the latest trading session, the Nifty closed at 24,698.85, gaining 126.20 points or 0.51%. The positive momentum is likely to continue if Nifty moves above the intraday resistance level of 24,750.
The Nifty opened positively at 24,636.30 and tested the intraday high of 24,734.30 before closing at 24,572.65. The banking, financial services, IT, and pharma sectors were the biggest gainers, while the media and FMCG sectors ended with a negative bias. Market breadth was positive, with 1,581 stocks rising, 1,010 falling, and 86 remaining unchanged. The top gainers in the Nifty index were SBILIFE, HDFCLIFE, BAJAJFINSV, and SHRIRAMFIN, while ONGC, BHARTIARTL, ADANIENT, and CIPLA were the major losers.
From a technical perspective, momentum indicators are showing a neutral trend, but the Nifty remains above both short-term and long-term moving averages. The index formed a white candle on the daily chart, closing higher than the previous day's close, which suggests a potential continuation of the uptrend. The index faces intraday resistance at 24,750; if it moves above this level, the bullish trend is expected to persist in the coming days. The nearest intraday support level is at 24,660.
Intraday Levels: Support: 24,660, 24,600, 24,525 Resistance: 24,750, 24,825-24,900 (15-Minute Charts)
Positional Trading Levels: Short-term Support: 24,475 - 23,900 Resistance: 25,100 - 25,600
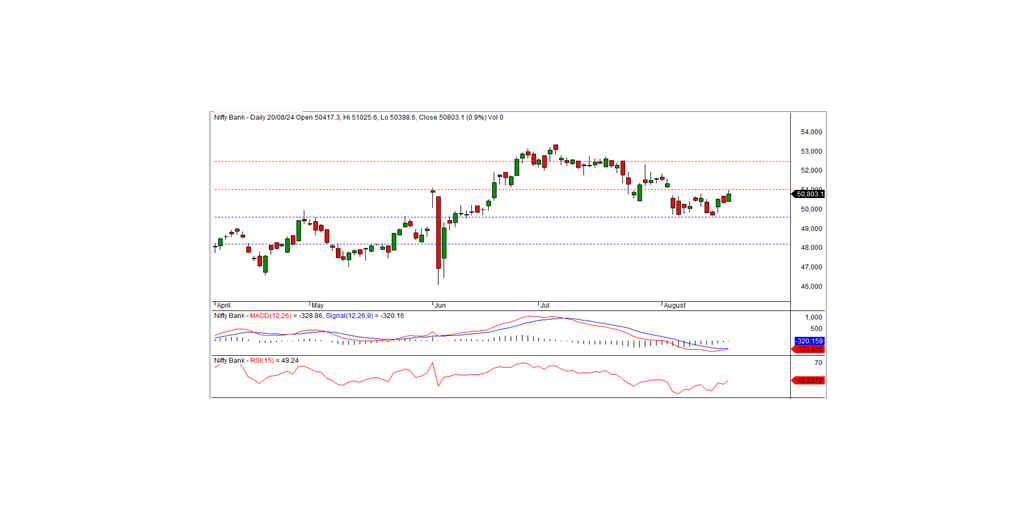
BANK NIFTY TECHNICAL OUTLOOK
In the preceding trading session, Bank Nifty closed at 50,803.15, registering a gain of 434.80 points.
Technical Analysis:
Although momentum indicators suggest a downward trend, the index remains above its short-term and long-term moving averages. Additionally, the index formed a white candle on the daily chart, closing above the previous day's close. This pattern indicates the possibility of continuing the uptrend. On the higher side, the index faces short-term resistance at the 51,000 level. If the index closes above this level, the short-term trend could turn bullish. The nearest intraday support is at 50,700.
Intraday Levels: Support: 50,700, 50,500, 50,300 Resistance: 50,900, 51,100, 51,300 (15-Minute Charts)
Positional Trading Levels: Support: 49,600 - 48,200 Resistance: 51,000 - 52,500