NIFTY TECHNICAL OUTLOOK
Market Closing on Wednesday, November 6, 2024
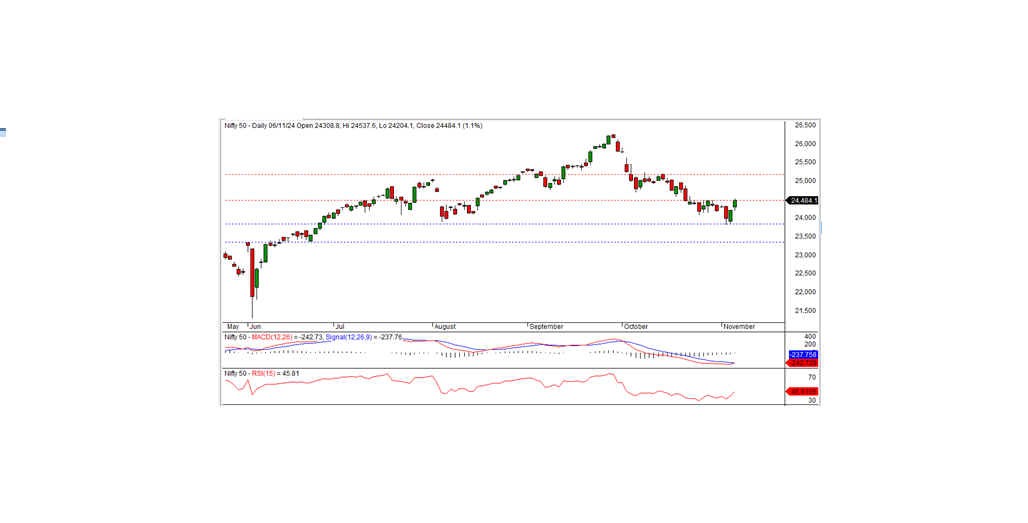
In the latest trading session, the Nifty ended at 24,484.05, marking an increase of 270.75 points, or 1.12%. A positive outlook could persist if the index surpasses its resistance at 24,500.
Nifty opened on a positive note at 24,308.80 and briefly dipped to an intraday low of 24,204.10. It then rallied to test an intraday high of 24,537.60 before closing at 24,484.05. All sectors ended in positive territory, led by gains in IT, realty, metal, and media. The market breadth was optimistic, with 2,136 stocks advancing, 524 declining, and 101 remaining unchanged. Key gainers in the Nifty included BEL, Adani Enterprises, TCS, and Infosys, while top losers were SBI Life, Titan, HDFC Life, and IndusInd Bank.
Technically, momentum indicators reflect a neutral trend, but the Nifty closed above its short-term moving averages, signaling potential bullish momentum. The formation of a white candle on the daily chart, along with a close near the session high, indicates strengthening bullish momentum. The index faces short-term resistance at 24,500.
The Nifty’s recent close above its short-term moving averages, along with positive sector performance and bullish momentum indicators, suggests that the market may be positioned for further gains. However, the immediate hurdle at 24,500 remains crucial; a break and close above this level could reinforce a bullish trend. Traders should watch for potential consolidation if the index remains below this resistance. Overall, the outlook leans positive, with intraday support at 24,435 providing a safety net for any minor pullbacks. A strong performance above these levels could indicate continued upward movement in the near term.
Intraday Levels: Support: 24,435, 24,340, 24,240 Resistance: 24,540, 24,625 - 24,700 (15-Minute Charts)
Positional Trading Levels: Short-term Support: 23,800 - 23,350 Resistance: 24,500 - 25,200

BANK NIFTY TECHNICAL OUTLOOK
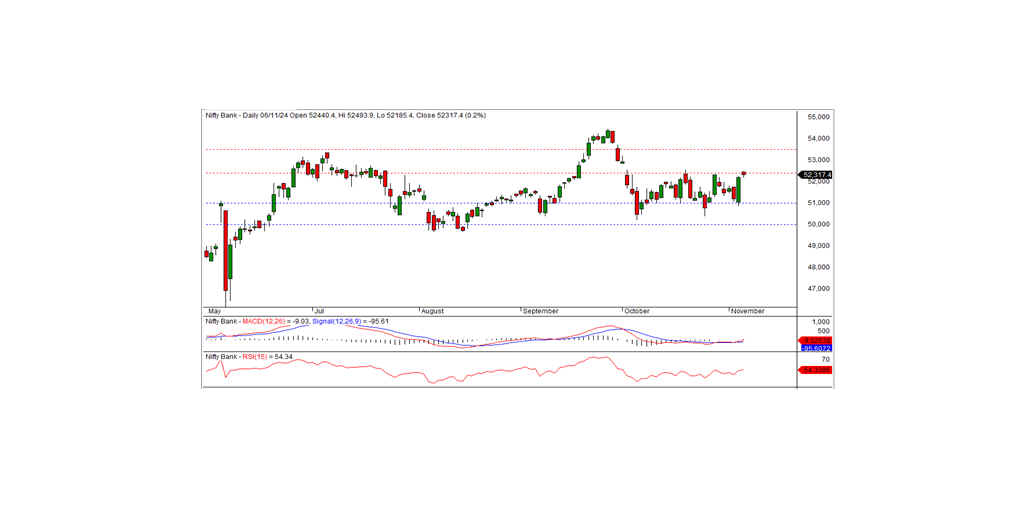
In the previous trading session, Bank Nifty closed at 52,317.40, gaining 110.15 points. Technically, momentum indicators signal a positive trend, and the index remains above its short- and medium-term moving averages. Although a small black candle formed on the daily chart, the close above the prior day’s high suggests potential for the uptrend to continue.
On the upside, Bank Nifty faces immediate resistance at 52,400. A sustained move above this level could reinforce the bullish trend in the days ahead. However, if the index fails to hold above this resistance, a period of consolidation below 52,400 may occur. The nearest intraday support lies at 52,200.
Intraday Levels: Support: 52,200, 51,950, 51,700 Resistance: 52,450, 52,700, 53,000 (15-Minute Charts)
Positional Levels: Short-term Support: 51,000 – 50,000 Resistance: 52,400 – 53,500

