Nifty Technical Outlook
Based on Market Closing on Thursday, July 25, 2024
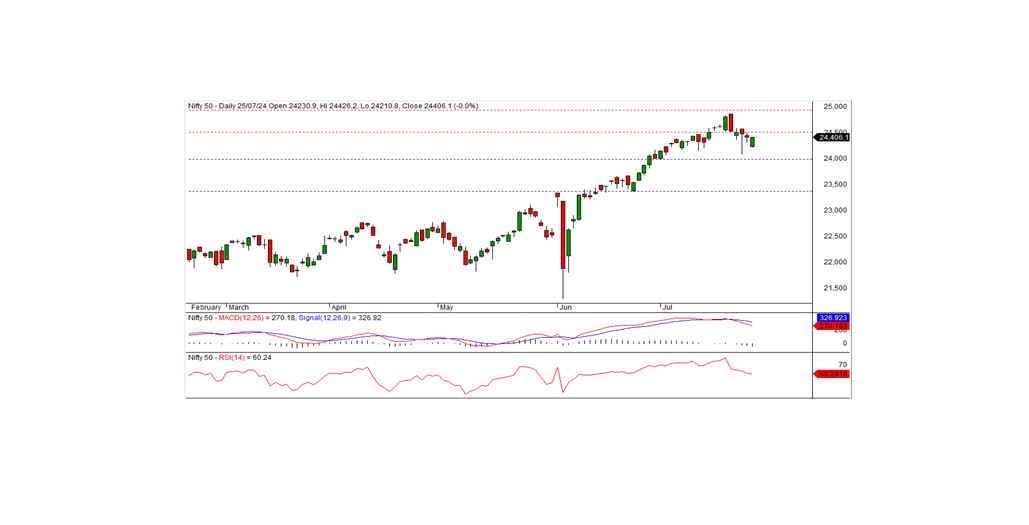
In the last trading session, the Nifty closed at 24,406.10, down by 7.40 points or 0.05 percent. The index must close above the 24,450-24,500 resistance levels to signal a positive trend.
The Nifty opened with a negative gap at 24,230.90, then gradually rose to test an intraday high of 24,426.20 before closing at 24,406.10. The auto, pharma, and media sectors closed with a positive bias, while metals, banks, realty, and financial services were the major losers. Market breadth was positive with 1,281 stocks rising, 1,250 falling, and 114 remaining unchanged. The top gainers in the Nifty index were TATAMOTORS, ONGC, SBILIFE, and BPCL. The major losers included AXISBANK, NESTLEIND, TITAN, and ICICIBANK.
From a technical standpoint, momentum indicators signal a negative trend. The Nifty remains below its short-term moving averages. The index formed a white candle on the daily chart and closed just below the previous day's close. On the higher side, the index faces resistance in the 24,450-24,500 area. A close above this level could turn the short-term trend positive. Otherwise, the recent downtrend may continue in the coming days. On the lower side, the index has intraday support at the 24,350 level.
Intraday Levels: Support: 24,350, 24,275, 24,200 Resistance: 24,450, 24,550-24,630 (15-Minute Charts)
Positional Trading: Short-term support: 24,000-23,365 Resistance: 24,500-25,000
Bank Nifty Technical Outlook
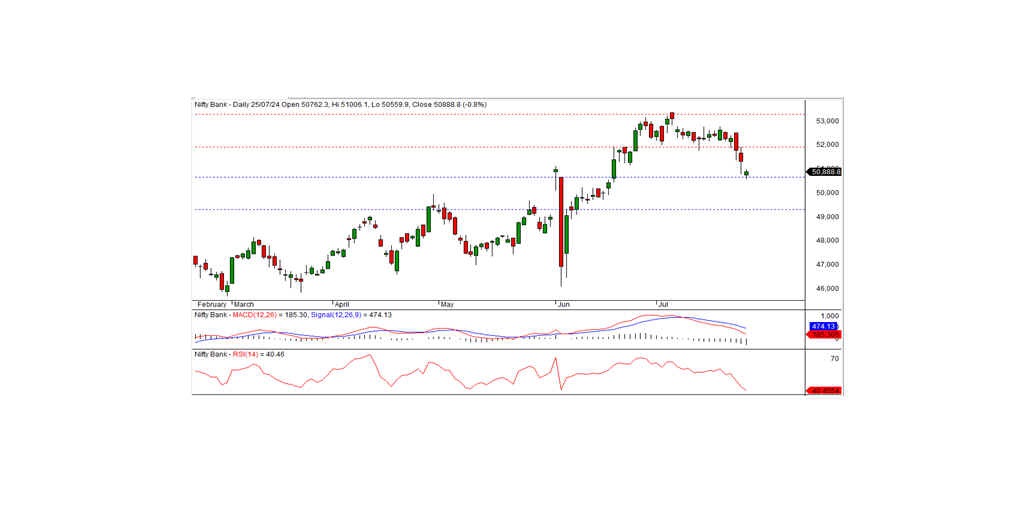
In the preceding trading session, Bank Nifty closed at 50,888.75, registering a loss of 428.25 points. Technically, the momentum indicators signal a negative trend, and the index remains below its short-term moving averages. Although the index formed a white candle on the daily chart, it closed below the previous day's close.
On the lower side, the index has short-term support at the 50,650 level and remains in the oversold region. If the index holds the support level of 50,650, there is a possibility of a pullback rally. Otherwise, the recent downtrend is likely to continue. The nearest intraday resistance is at the 51,100 level.
Intraday Levels: Support: 50,800, 50,600, 50,300 Resistance: 51,000, 51,400, 51,700 (15-Minute Charts)
Positional Trading: Short-term support: 50,650-49,300 Resistance: 51,900-53,250