NIFTY TECHNICAL OUTLOOK
Based on Market Closing on Saturday, February 1, 2025
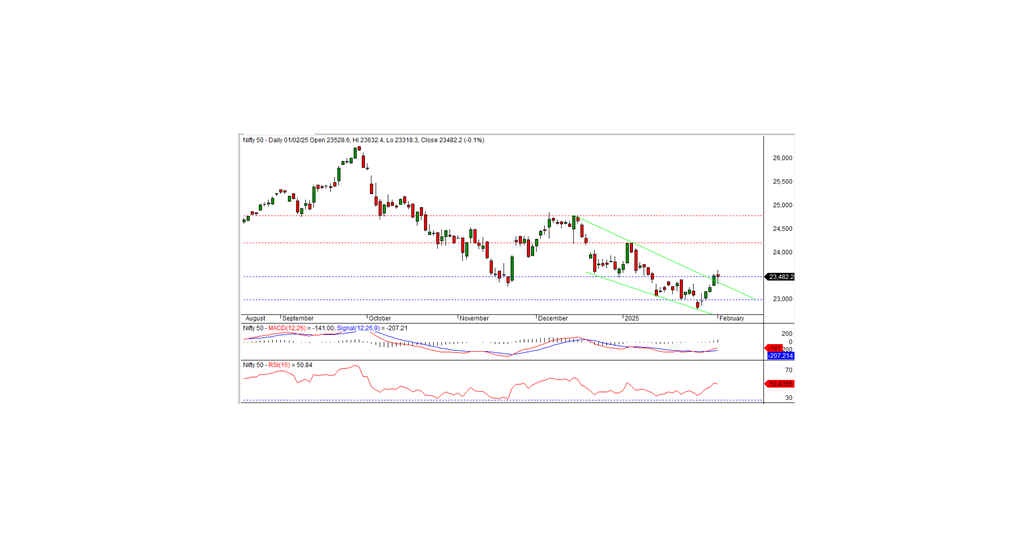
The Nifty closed at 23,482.15, down 26.25 points (-0.11%). For the index to regain a positive trend, it must move above 23,500.
During the session, Nifty opened on a positive note at 23,528.60, reaching an intraday high of 23,632.40 before declining to a low of 23,318.30 and closing at 23,482.15. Sector-wise, realty, FMCG, media, and auto led the gains, while PSU banks, IT, metal, and pharma were the biggest laggards. Market breadth remained slightly positive, with 1,434 stocks advancing, 1,279 declining, and 144 unchanged. The top Nifty gainers were TRENT, MARUTI, TATACONSUM, and EICHERMOT, while POWERGRID, BEL, LT, and GRASIM were the major losers.
Technical View
Momentum indicators suggest a mildly positive trend, with Nifty holding above its short-term moving averages. However, the formation of a small black candle on the daily chart, closing just below the previous session, indicates a slightly negative bias. A breakout above 23,500 is crucial for the bullish trend to resume. Otherwise, the index may enter a consolidation phase. Immediate intraday support is at 23,435.
Key Levels Intraday Support: 23,435, 23,350, 23,250 Intraday Resistance: 23,550, 23,650-23,750 (15-Minute Charts)
Positional Support: 23,000-22,500 Positional Resistance: 23,500-24,200
The Nifty remains at a crucial juncture, with 23,500 acting as a key resistance level. While momentum indicators suggest strength, the formation of a small black candle indicates some hesitation in the market. A decisive move above 23,500 could resume the bullish trend, while failure to do so may lead to consolidation or a mild correction. Traders should closely watch support at 23,435 and resistance at 23,500 for further market direction.

Bank Nifty Technical Outlook
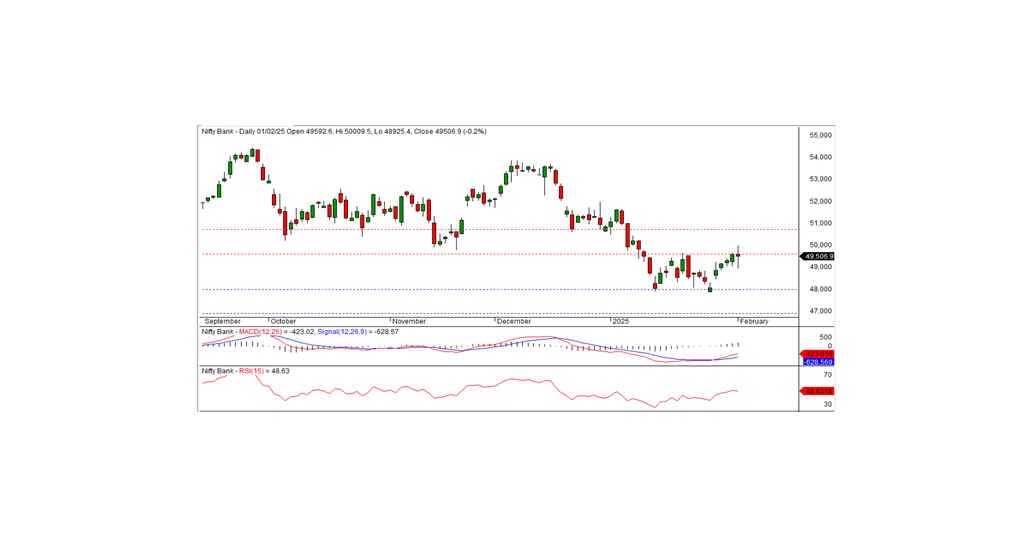
Bank Nifty ended the session at 49,506.40, registering a loss of 80.25 points. While technical indicators remain positive, the formation of a black candle on the daily chart suggests a slight negative bias as the index closed below the previous day's level.
On the upside, 49,600 acts as a key short-term resistance. A decisive close above this level could resume the uptrend, while failure to do so may lead to consolidation or further downside. The nearest intraday support is at 49,350.
Key Levels to Watch Intraday Trading (15-Minute Charts): Support: 49,350, 49,100, 48,850 Resistance: 49,660, 50,000, 50,300
Positional Trading: Support: 48,000–47,000 Resistance: 49,600–50,700

