NIFTY TECHNICAL UPDATE
Based on the market's closing data on Thursday, December 28, 2023,
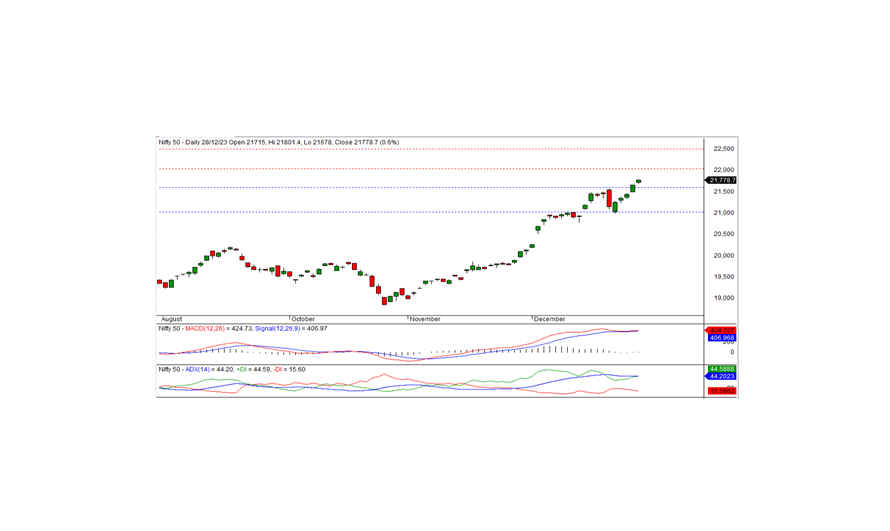
The Nifty concluded the trading session at a historic peak of 21,778.70, securing a gain of 123.95 points or 0.57 percent. Sustaining the bullish momentum hinges on the index surpassing the 21,800 level.
Commencing at the 21,715 level on a positive note, the Nifty sustained this upward trend throughout the session, reaching a record high of 21,801.40 before settling at 21,778.70. Except IT, all sectors closed positively, with FMCG, pharma, PSU banks, and auto emerging as the major sector gainers. The market breadth displayed negativity, witnessing 1,065 stocks rising, 1,307 falling, and 128 remaining unchanged. Among the top gainers beneath the Nifty were COAL INDIA, M&M, HEROMOTOCO, and NTPC, while the major losers included ADANIENT, ADANIPORTS, LT, and EICHERMOT.
From a technical perspective, the Nifty maintains its position above both short-term and long-term moving averages. Momentum indicators also affirm a robust positive trend. Additionally, the daily chart reveals a formation of a white candle, closing above the preceding day's conclusion, hinting at the potential for a continued uptrend. The index faces intraday resistance at the 21,800 level, and breaching this barrier could extend the positive trajectory. The closest intraday support stands at 21,725 levels.
Intraday Support Levels: 21,725 - 21,665 - 21,600 Resistance Levels: 21,800 - 21,900 - 22,000 (15 Minute Charts)
For positional traders, short-term support is noted at 21,600 - 21,000, with resistance levels at 22,000 - 22,500.
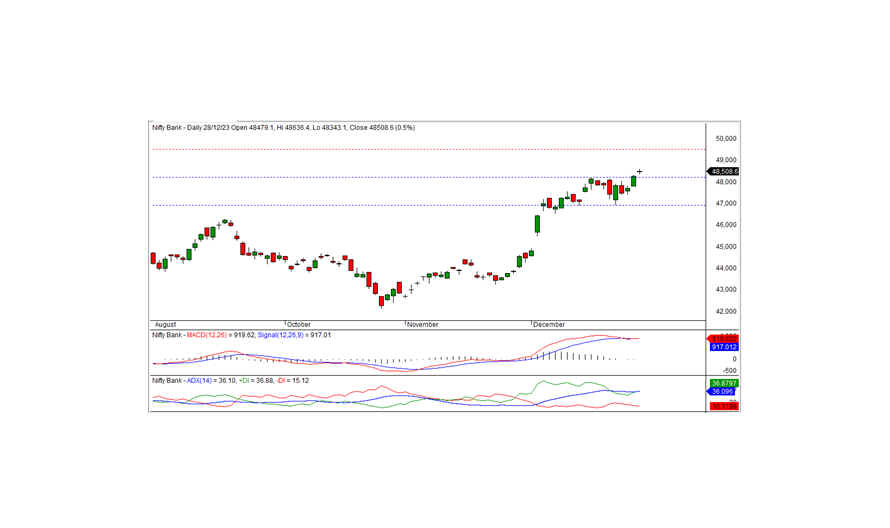
BANK NIFTY UPDATE
In the previous trading session, Bank Nifty achieved a historic high, closing at 48,508.55 and marking a gain of 226.35 points. From a technical standpoint, momentum indicators continue to signal a positive trend, with the index maintaining its position above both medium-term and long-term moving averages. Notably, the daily chart reflects the formation of a Doji candle, culminating in a record-high close. These factors collectively suggest the potential for the continuation of the bullish trend.
On the upside, the index faces intraday resistance at 48,600, while the corresponding support is positioned at 48,400. A breakthrough above the 48,600 level today could sustain the positive momentum.
For intraday traders, support levels are identified at 48,400, 48,200, and 48,000, with corresponding resistance levels at 48,600, 48,800, and 49,000, as indicated by the 15-minute charts.
Positional traders are advised to keep an eye on short-term support levels at 48,200-47,000, while resistance is noted at 49,500-50,700.