NIFTY TECHNICAL REVIEW
As of the market close on Wednesday, November 08, 2023
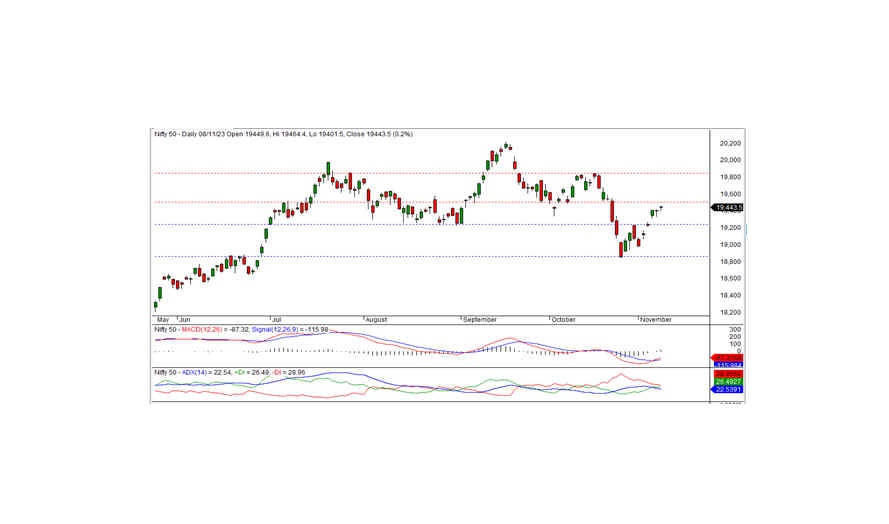
The Nifty concluded the session at 19443.60, marking a gain of 36.80 points or 0.19 percent. Sustaining above 19400 will likely maintain the positive momentum.
Opening at 19449.60 with a positive bias, the Nifty experienced an intraday low of 19401.50 before rebounding to reach an intraday high of 19464.40. The closing figure stood at 19443.60. Noteworthy gainers included realty, pharma, metals, and FMCG, while financial services, IT, and banking witnessed declines. Market breadth reflected positivity, with 1282 stocks rising, 1035 falling, and 168 remaining unchanged. Top gainers beneath the Nifty umbrella were BPCL, ADANIPORTS, ASIANPAINT, and CIPLA, whereas major losers included ICICIBANK, NTPC, INFY, and TECHM.
From a technical standpoint, the Nifty maintains a position above short-term moving averages, with momentum indicators indicating a positive trend. Despite the formation of a Doji candle on the daily chart and a close just above the previous day's closing, this pattern suggests a potential continuation of the uptrend. The nearest intraday support stands at 19400. A sustained trade above this level could signify the persistence of the bullish trend today, with an intraday resistance at 19465.
Intraday Support Levels: 19400-19350-19310 Resistance Levels: 19465-19510-19550 (15 Minute Charts)
For positional traders, short-term support levels are identified at 19233-18880, with resistance at 19500-19800.

BANK NIFTY
In the last trading session, Bank Nifty concluded at 43658.65, marking a loss of 79.25 points. From a technical standpoint, momentum indicators signal a positive trend, and the index remains positioned above short-term moving averages.
Analyzing the daily chart, the index formed a black candle and closed below the previous day's close, suggesting a slightly negative bias. On the upside, the intraday resistance persists at 43700. Surpassing this level could extend the positive momentum in the upcoming days. The nearest intraday support is at 43550, and a dip below this level may indicate a slightly negative trend.
For intraday traders, support levels are identified at 43550, 43415, and 43300, while resistance levels can be found at 43700, 43800, and 43950, as indicated by the 15-minute charts.
Positional traders are advised to monitor short-term support levels at 43500-42800, with resistance ranging from 44000 to 44650.

