NIFTY TECHNICAL OUTLOOK
Based on Market Closing on Thursday, December 14, 2023
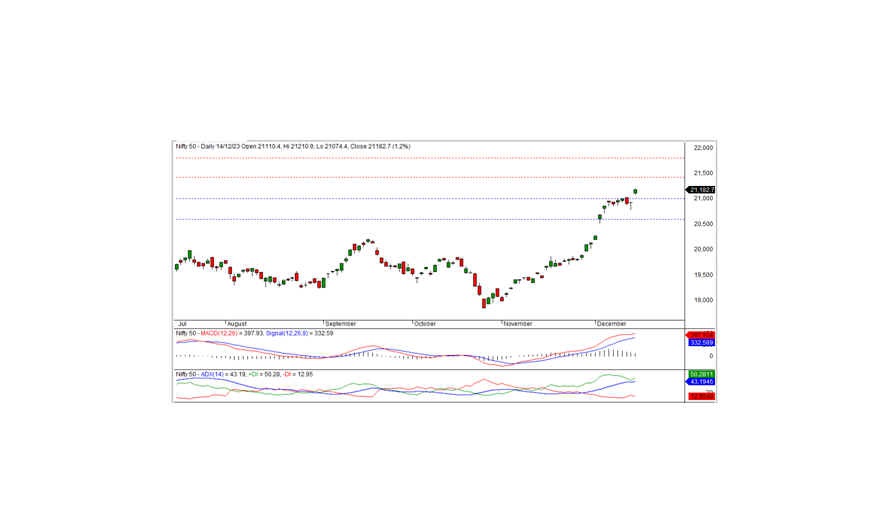
The Nifty concluded the trading session at 21,182.70, marking a gain of 256.35 points or 1.23 percent. The bullish momentum is anticipated to persist as long as the index remains above 21,000.
Opening at the level of 21,110.40 with an upward gap, the Nifty maintained its bullish trend throughout the session, reaching a record high of 21,210.90 before closing at 21,182.70. All sectors, except for the media, closed positively, with realty, IT, private banks, and financial services leading the gains. Market breadth was positive, with 1,250 stocks rising, 1,100 falling, and 134 remaining unchanged. Notably, TECHM, LTIM, INFY, and WIPRO emerged as top gainers, while POWERGRID, HDFCLIFE, NESTLEIND, and CIPLA faced losses.
From a technical perspective, the Nifty remains above both short-term and long-term moving averages, with momentum indicators signaling a positive trend. The daily chart reveals a white candle closing well above the previous day's close, indicating ongoing momentum favoring the bulls. On the downside, the index has short-term support at 21,000 levels, and sustaining above this level may lead to continued bullish momentum in the coming days. The next short-term resistance is identified at 21,400 levels.
Intraday Levels (15-Minute Charts): Support: 21,135 - 21,070 - 21,020 Resistance: 21,210 - 21,275 - 21,350
Positional Trading: Short-term Support: 21,000 - 20,600 Resistance: 21,400 - 21,800
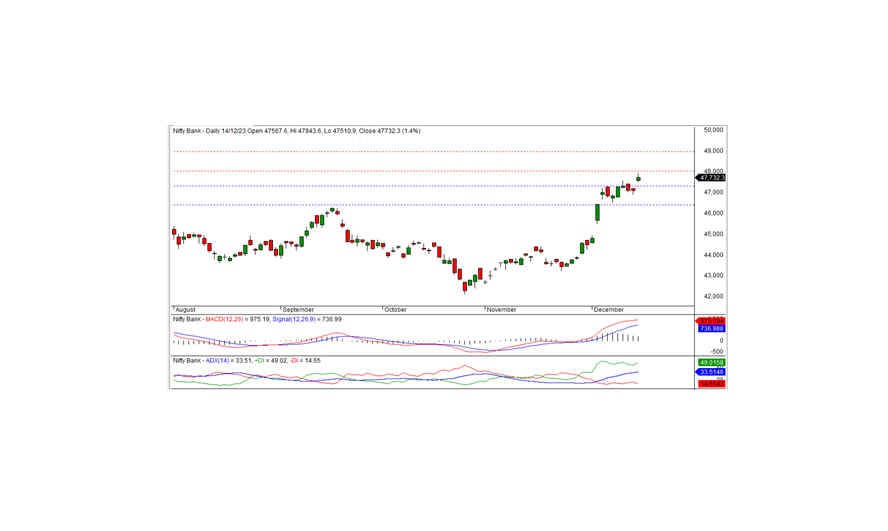
BANK NIFTY
In the recent trading session, Bank Nifty achieved a record high, closing at 47,732.30 and gaining 640.05 points. From a technical standpoint, momentum indicators are signaling a positive trend, and the index remains positioned above both short-term and long-term moving averages. Furthermore, the daily chart reveals a white candle, closing above the previous day's close, suggesting that the bullish trend is likely to persist in the coming days.
On the downside, the index has short-term support at 47,300. If the index trades and maintains above this level, there is potential for testing the next short-term resistance of 48,000 in the upcoming days.
For intraday traders, support levels are observed at 47,675, 47,500, and 47,350, while resistance levels are indicated at 47,930, 48,125, and 48,300, as depicted by the 15-minute charts.
Positional traders should consider: Short-term Support: 47,300 - 46,400 Resistance: 48,000 - 49,000