NIFTY TECHNICAL ANALYSIS
As of the market closing on Friday, December 15, 2023
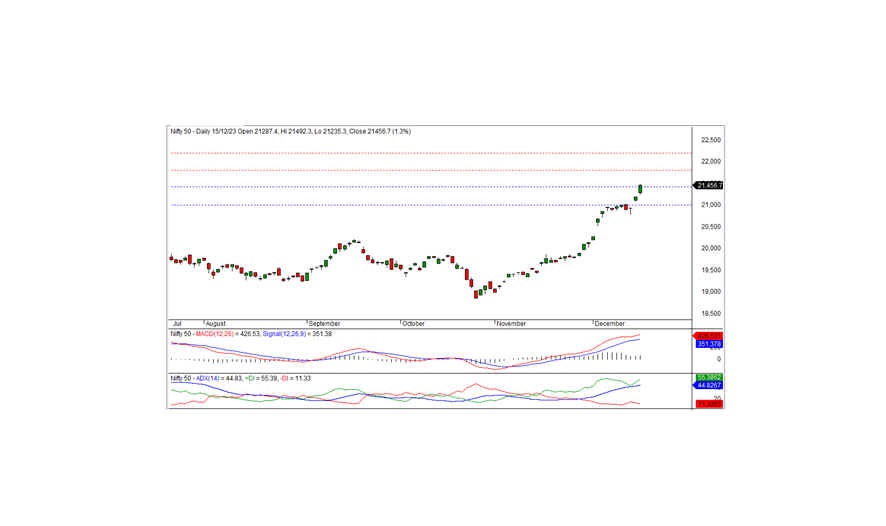
The Nifty concluded the trading session at an all-time high of 21,456.65, marking a substantial gain of 273.95 points or 1.29 percent. Sustained bullish momentum is anticipated as long as the index maintains levels above 21,400.
Opening at 21,287.40 with an upward gap, the Nifty continued its bullish trajectory, reaching a pinnacle of 21,492.30 during the session before settling at 21,456.65. Noteworthy sector gainers included IT, banks, and metals, whereas realty, FMCG, media, and auto witnessed declines. The market breadth displayed a positive trend, with 1,256 stocks rising, 1,125 falling, and 104 remaining unchanged. Notable gainers beneath the Nifty umbrella were HCLTECH, TCS, INFY, and SBIN, while NESTLEIND, HDFCLIFE, BHARTIARTL, and SBILIFE experienced significant losses.
From a technical standpoint, the Nifty maintains its position above both short-term and long-term moving averages. Momentum indicators affirm a positive trend. Furthermore, the index formed a white candle on the daily chart, closing well above the previous day's conclusion, indicating a prevailing bullish momentum. On the downside, short-term support is observed at 21,400 levels. The persistence of the index above this threshold suggests the continuation of bullish momentum in the days ahead. The subsequent short-term resistance is anticipated at 21,800 levels.
Intraday Support Levels: 21,400 - 21,300 - 21,200 Resistance Levels: 21,500 - 21,600 - 21,700 (15 Minute Charts)
For positional traders, short-term support levels remain at 21,400 - 21,000, with resistance observed at 21,800 - 22,200. The technical outlook supports a favorable stance for the bulls in the prevailing market conditions.

BANK NIFTY ANALYSIS
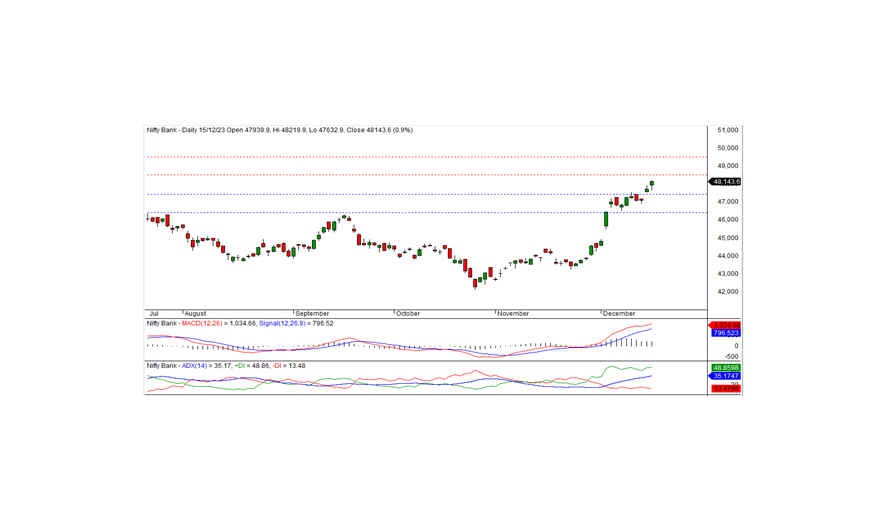
In the most recent trading session, Bank Nifty achieved a historic closing high at 48,143.55, marking an impressive gain of 411.25 points. From a technical standpoint, momentum indicators strongly signal a positive trend, with the index positioned comfortably above both short-term and long-term moving averages. Additionally, the formation of a white candle on the daily chart, closing above the preceding day's level, suggests a robust bullish sentiment that may extend into the upcoming days.
On the upside, the index encounters intraday resistance at 48,200. A sustained trade above this level is crucial for the continuation of the bullish trend. The subsequent short-term resistance is identified at 48,500 levels.
For intraday traders, key support levels are identified at 48,000, 47,850, and 47,650, while resistance levels are notable at 48,200, 48,400, and 48,600, as highlighted by the 15-minute charts.
Positional traders are advised to monitor short-term support levels at 47,400 - 46,400, with resistance observed at 48,500 - 49,500. The overall technical analysis supports a positive outlook for the bullish trajectory in the Bank Nifty.

