NIFTY TECHNICAL OUTLOOK
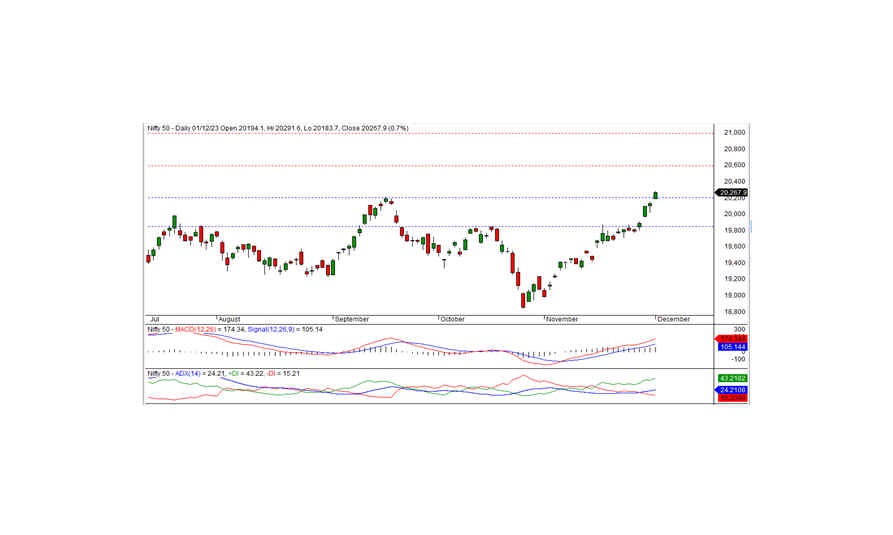
Based on the market closing on Friday, December 01, 2023, the Nifty achieved a remarkable milestone by concluding the trading session at a record high of 20267.90, registering a gain of 134.75 points or 0.67 percent. The bullish momentum is poised to persist if the index continues to trade and sustain above the 20200 mark.
Opening at 20194.10 with a positive bias, the Nifty maintained this momentum throughout the session, reaching an all-time high of 20291.60 before settling at 20267.90. Apart from the auto sector, all other sectors closed positively, with notable gains observed in media, PSU banks, FMCG, and realty. The market breadth reflected positivity, with 1289 stocks rising, 1055 falling, and 140 remaining unchanged. Top gainers under the Nifty included ITC, NTPC, AXISBANK, and LT, while major losers were HEROMOTOCO, M&M, WIPRO, and HDFCLIFE.
Technically, the Nifty maintains its position above both short-term and long-term moving averages, and momentum indicators signal a positive trend. A white candle on the daily chart, closing at an all-time high, further supports the potential continuation of bullish momentum in the upcoming days. On the downside, the index finds short-term support at 20200 levels. As long as the index remains above this level, the bullish momentum is likely to persist, with a possible test of the next short-term resistance at 20600 in the days ahead.
Intraday support levels are identified at 20200-20125-20050, while resistance levels stand at 20300-20400-20500 based on 15-minute charts. For positional traders, short-term support levels are maintained at 20200-19850, with resistance at 20600-21000.

BANK NIFTY
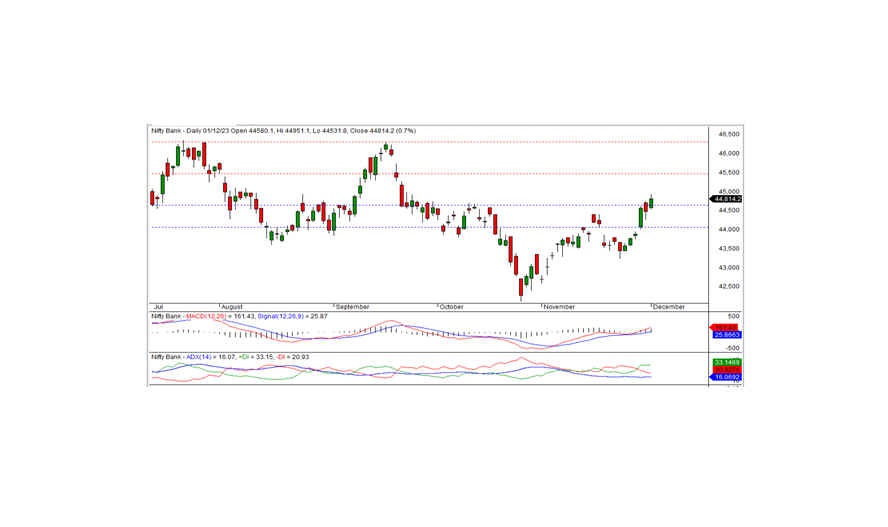
In the recent trading session, Bank Nifty concluded at 44814.50, marking a notable gain of 332.45 points. From a technical standpoint, momentum indicators distinctly indicate a positive trend, and the index sustains its position above both short-term and long-term moving averages. Notably, a white candle formation on the daily chart, coupled with a close above the short-term resistance of 44650, signifies ongoing bullish momentum. Should the index persist above 44650, the favorable trend for the bulls is anticipated to continue in the forthcoming days, with the next short-term resistance identified at 45500 levels.
For intraday traders, support levels are identified at 44700, 44475, and 44275, while resistance levels are positioned at 44950, 45200, and 45400, based on insights from the 15-minute charts.
Positional traders are advised to monitor short-term support levels at 44650-44000, with resistance levels positioned at 45500 - 46300. This analysis provides a comprehensive view for traders to make informed decisions based on the prevailing technical outlook for Bank Nifty.

