NIFTY TECHNICAL OUTLOOK
Based on Market Closing on Monday, April 08, 2024
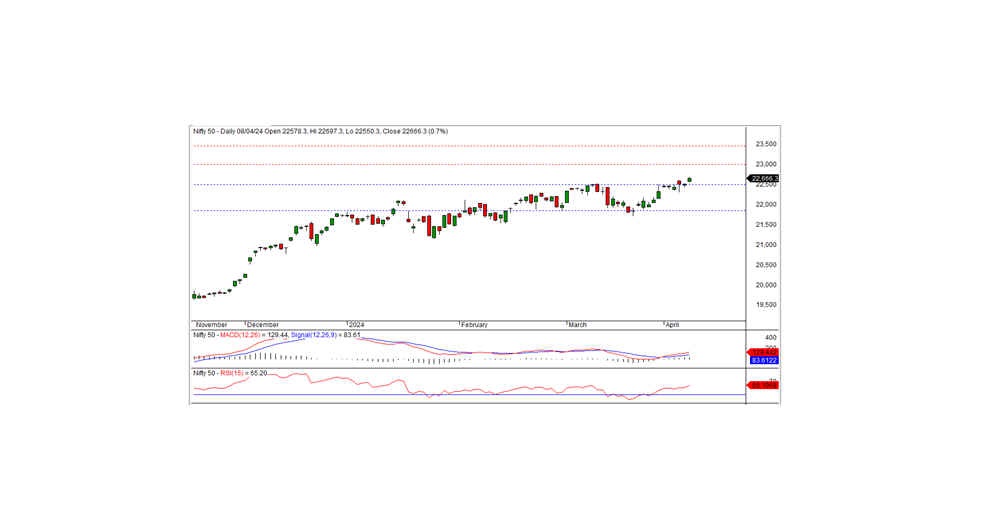
In the recent trading session, the Nifty concluded near its all-time high at 22666.30, marking a gain of 152.60 points or 0.68 percent. The ongoing positive momentum is poised to persist as long as the Nifty holds above the 22620 mark.
During the last trading session, the Nifty commenced trading at 22578.30 with a positive sentiment, sustaining this trend and reaching an all-time high of 22697.30 before settling at 22666.30. Key sector gainers included auto, realty, metal, and pharma, while PSU banks, media, and IT sectors witnessed declines. Market breadth leaned towards negativity, with 1091 stocks rising, 1328 falling, and 167 unchanged. Notable performers among Nifty stocks were EICHERMOT, MARUTI, M&M, and NTPC, whereas ADANIPORTS, NESTLEIND, APOLLOHOSP, and WIPRO faced losses.
From a technical perspective, the Nifty maintains positions above both short-term and long-term moving averages, with momentum indicators signaling a positive trend. The daily chart depicted a small white candlestick, reinforcing the bullish sentiment, and closed near the all-time high. These factors collectively favor the bullish momentum. In terms of intraday trading, the Nifty encounters resistance around 22700; surpassing this level could sustain the bullish trend in the forthcoming sessions. The subsequent short-term resistance stands at 23000.
Intraday Levels: Support - 22620, 22550, 22460 Resistance - 22700, 22775, 22850 (15-Minute Charts)
Positional Trading: Short-term support - 22500-21850 Resistance - 23000- 23500.
BANK NIFTY
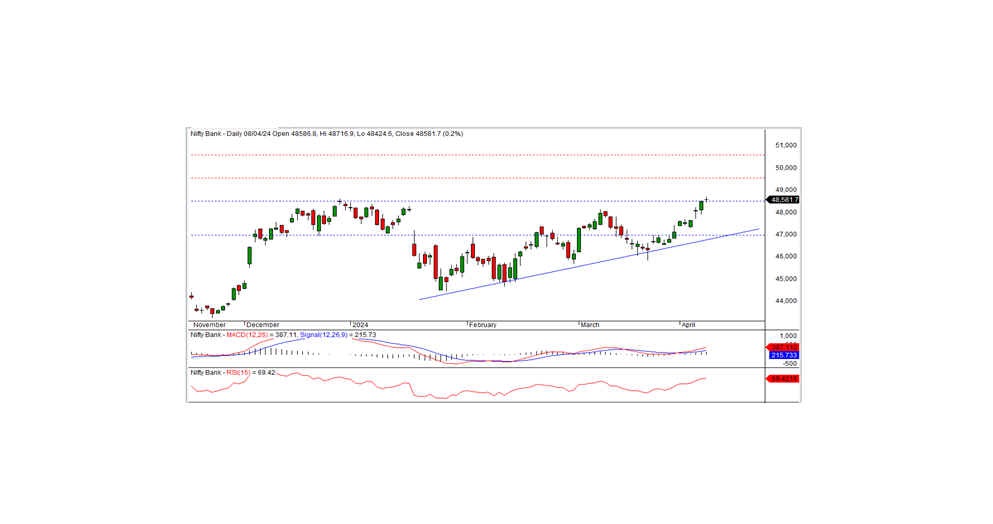
In the previous trading session, Bank Nifty closed at 48581.70, marking a gain of 88.65 points. Technically, momentum indicators continue to signal a positive trend, with the index maintaining positions above both short-term and long-term moving averages. Additionally, the formation of a Doji candle on the daily chart and the closure above the previous resistance of 48500 indicates positive sentiment. Sustaining above this level could extend the bullish trend in the upcoming days, with the next short-term resistance anticipated at 49500 levels.
For intraday traders, support levels are identified at 48450, 48200, and 48000, while resistance levels are indicated at 48680, 48950, and 49200, as suggested by the 15-minute charts.
Positional traders should monitor short-term support levels at 48500-47000, with resistance observed at 49500-50500.