
NIFTY TECHNICAL ANALYSIS
Based on Market Closing on Monday, March 18, 2024
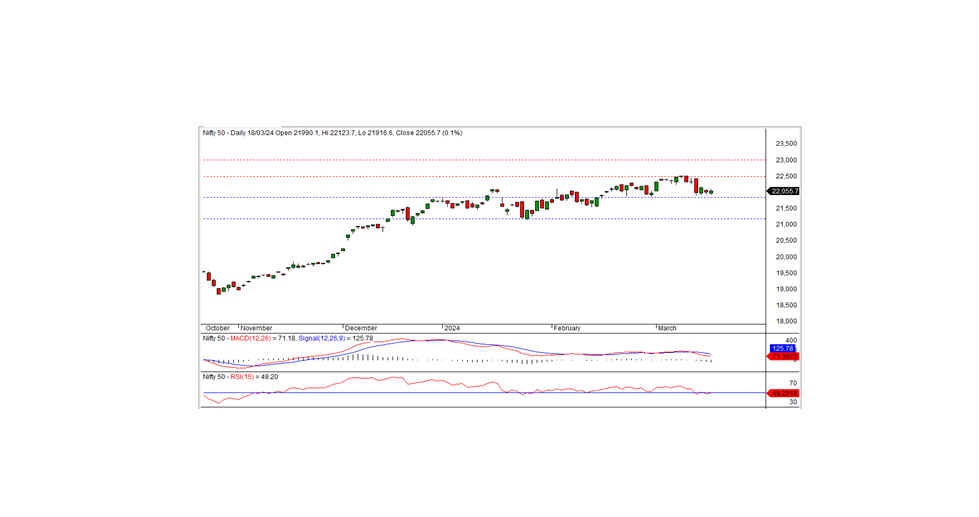
In the most recent trading session, the Nifty concluded at 22,055.70, marking a modest gain of 32.35 points or 0.15 percent. If the nifty remains above the 22000 level, the positive trend can continue today.
In the last trading session, the Nifty opened at 21990.10 level on a negative note and hit the intraday low of 21916.60 in the morning trade. Then the index gradually rose and tested the intraday high of 22123.70 and finally closed at 22055.70. Notable sectoral gainers included metal, media, and pharma, while IT, FMCG, private banks, and financial services experienced declines. Market breadth tilted negative, with 1,196 stocks advancing, 12,361 declining, and 131 remaining unchanged. Prominent performers within the Nifty were TATASTEEL, M&M, JSWSTEEL, and TATAMOTORS, whereas TATACONSUM, UPL, INFY, and TCS were among the leading decliners.
Technically, the Nifty remains positioned below short-term moving averages, with momentum indicators signaling a negative bias. Nevertheless, a small white candle formed on the daily chart, coupled with a close above the previous day's level, suggests the presence of positive sentiment. Over the past three trading sessions, the Nifty has maintained a consolidation phase between the levels of 21,900 to 22,200. A decisive breakout above or below these levels is essential to ascertain a clear directional bias. Immediate intraday resistance is observed at 22,100, with support at 22,000.
Intraday Levels: Support: 22,000, 21,900, 21,800 Resistance: 22,100, 22,200, 22,300 (15-Minute Charts)
Positional Trading: Short-term Support: 21,850-21,200 Resistance: 22,500-23,000
BANK NIFTY TECHNICAL ANALYSIS
In the previous trading session, Bank Nifty concluded at 46,575.90, marking a marginal loss of -18.20 points. From a technical perspective, momentum indicators continue to signal a negative trend, with the index positioned below short-term moving averages. Additionally, the formation of a Doji candle on the daily chart, closing below the previous day's level, indicates a cautious sentiment. The long lower shadow of the candle suggests the emergence of buying support near the support zone. Immediate intraday resistance is observed at the 46,700 level. A positive trend can be expected if the index surpasses this level.
For intraday traders, support levels are identified at 46,400, 46,200, and 45,900, whereas resistance levels are marked at 46,700, 47,000, and 47,200 according to the 15-minute charts.
Positional traders are advised to monitor short-term support levels in the range of 46,000-44,500, while resistance is noted at 47,000-48,500.
