NIFTY TECHNICAL ANALYSIS
Based on Market Closing Data as of Friday, March 15, 2024
In the latest trading session, the Nifty concluded at 22023.35, registering a decline of 123.30 points or 0.56 percent. The closest short-term support level stands at 21850.
The Nifty commenced the trading day at 22064.80, opening on a negative note, and dipped to an intraday low of 21931.70 during morning trade. However, the index recovered in the afternoon, ultimately closing at 22023.35. Apart from the metal and FMCG sectors, all others ended with a negative bias. Notably, the auto, pharma, IT, and banking sectors experienced significant losses. Market breadth was adverse, with 1123 stocks advancing, 1331 declining, and 108 remaining unchanged. Among the top performers were UPL, BHARTIARTL, BAJFINANCE, and HDFCLIFE, whereas major losers included M&M, BPCL, COAL INDIA, and TATA MOTORS.
From a technical perspective, the Nifty persists below its short-term moving averages, with momentum indicators indicating a negative trend. Additionally, the formation of a small black candle on the daily chart, closing within the prior day's candle, hints at a potential consolidation phase. On the lower side, the index has short-term support at the 21850 level. A breach below this could sustain the downtrend. Otherwise, the index may consolidate above the support level for a few more days. The closest intraday resistance is situated at 22050 levels.
Intraday Levels: Support - 21925, 21850, 21775 Resistance - 22050, 22125, 22200 (15-Minute Charts)
Positional Trading: Short-term Support - 21850-21200 Resistance - 22500-23000.

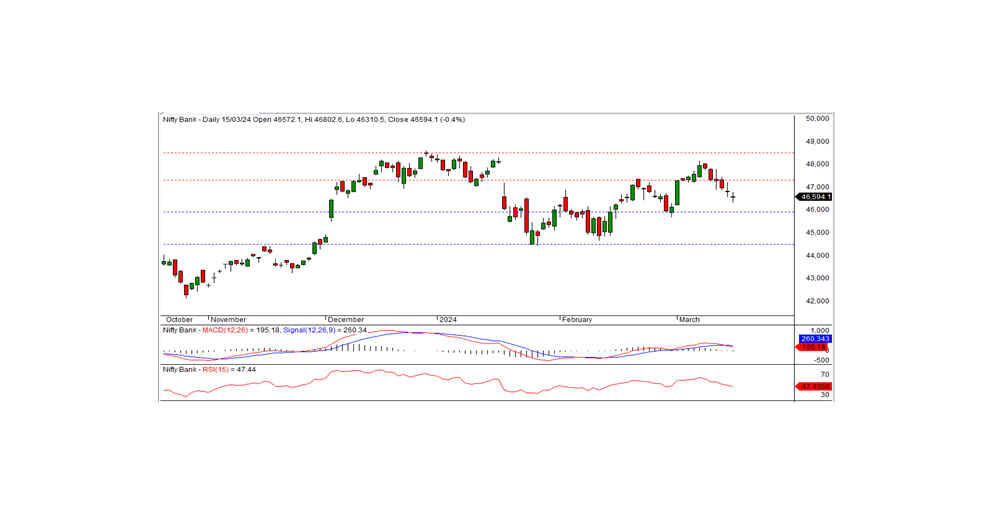
BANK NIFTY ANALYSIS
During the previous trading session, the Bank Nifty concluded at 46594.10, marking a loss of 195.85 points. From a technical perspective, momentum indicators suggest a negative trend, with the index remaining below its short-term moving averages. Additionally, the formation of a Doji candle on the daily chart, closing beneath the prior day's close, indicates the potential continuation of the downtrend. The nearest short-term support level is identified at 46000, while an intraday resistance level is noted at 46700.
For intraday traders, support levels are observed at 46400, 46130, and 45900, while resistance levels are indicated at 46675, 47000, and 47200, as depicted by the 15-minute charts.
Positional traders are advised to monitor short-term support levels at 46000-44500, with resistance noted at 47000-48500.