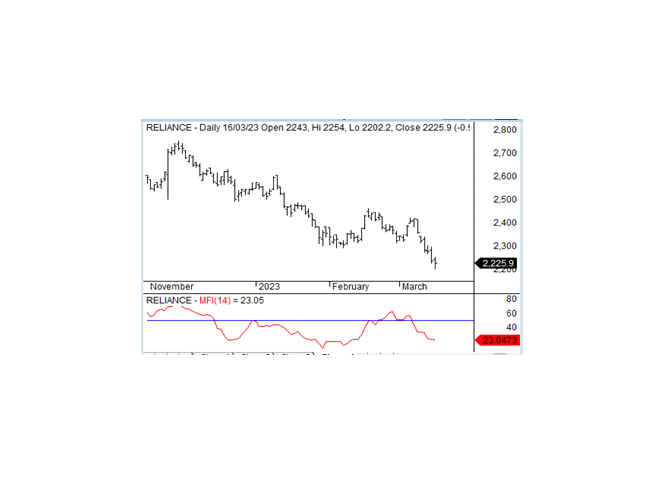
Money Flow Index(MFI)
MFI stands for the Money Flow Index, which is a momentum indicator that measures the flow of money into and out of a security over a given time period. The default time period for MFI is 14 periods, but traders can adjust this based on their preferences.
To calculate the MFI indicator, you first calculate the typical price for each period by adding the high, low, and close prices and dividing by three. You then calculate the raw money flow by multiplying the typical price by the volume traded for the period. Next, you determine whether the money flow is positive or negative based on whether the typical price is higher or lower than the previous period's typical price. Finally, you calculate the money flow ratio by dividing the sum of positive money flow over the given time period by the sum of negative money flow over the same period.
The MFI indicator is then calculated using the money flow ratio and a scale of 0 to 100. The formula for calculating the MFI indicator is:
MFI = 100 - (100 / (1 + Money Flow Ratio))
The values for the MFI indicator can range from 0 to 100. If the MFI is above 50, it indicates that the security is experiencing buying pressure, and the trader may consider buying the security. Conversely, if the MFI is below 50, it indicates that the security is experiencing selling pressure, and the trader may consider selling the security.
Traders can use the MFI indicator for buying and selling stocks by using the following strategies:
Overbought/oversold: Traders can use the MFI indicator to identify overbought and oversold conditions. If the MFI is above 80, it indicates that the security is overbought, and the trader may consider selling the security. If the MFI is below 20, it indicates that the security is oversold, and the trader may consider buying the security.
Divergence: Traders can also look for divergences between the MFI indicator and the security's price. If the security is making new highs while the MFI indicator is not, it may suggest that the uptrend is losing momentum and that it may be time to sell the security. Conversely, if the security is making new lows while the MFI indicator is not, it may suggest that the downtrend is losing momentum and that it may be time to buy the security.
It is important to note that the MFI indicator, like all technical indicators, should be used in conjunction with other tools and analysis to make informed trading decisions. Additionally, traders should be aware of the limitations of the indicator, such as its tendency to give false signals in choppy or sideways markets.