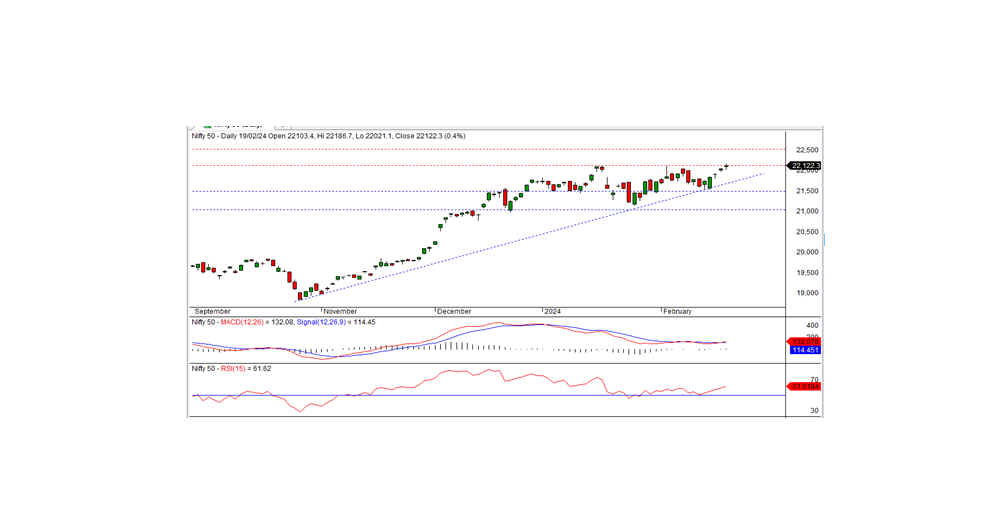
NIFTY TECHNICAL OUTLOOK
Based on Market Closing on Monday, February 19, 2024
During the last trading session, the Nifty concluded at 22122.25, marking an increase of 81.55 points or 0.37 percent. Should the Nifty continue to trade above 22125, the bullish trend is likely to persist in the upcoming days.
The Nifty commenced at 22103.40, reaching an intraday low of 22021.10 before gradually ascending to test the record high of 22186.70, ultimately closing at 22122.25. Leading the gains were the pharma, FMCG, media, and financial services sectors, while realty, PSU banks, and IT were among the losers. Market breadth remained positive, with 1533 stocks rising, 898 falling, and 107 unchanged. Noteworthy gainers beneath the Nifty included GRASIM, BAJAJFINSV, BAJAJ-AUTO, and CIPLA, while major losers comprised COALINDIA, LT, SBILIFE, and WIPRO.
From a technical standpoint, the Nifty continues to stay above both short-term and long-term moving averages, with momentum indicators signaling a positive trend. A Doji candle was formed on the daily chart, closing above the preceding day's close. Resistance for the Nifty stands at 22125 levels. Should the index persist above this level, the bullish trend is expected to endure in the forthcoming days. Conversely, if the index remains below this level, the index may consolidate for a few days. The closest intraday support is at 22100 levels.
Intraday Support Levels: 22100-22025-21950 Resistance Levels: 22185-22265-22350 (15 Minute Charts)
For positional traders, short-term support levels remain at 21500-21000, with resistance observed at 22125-22500.
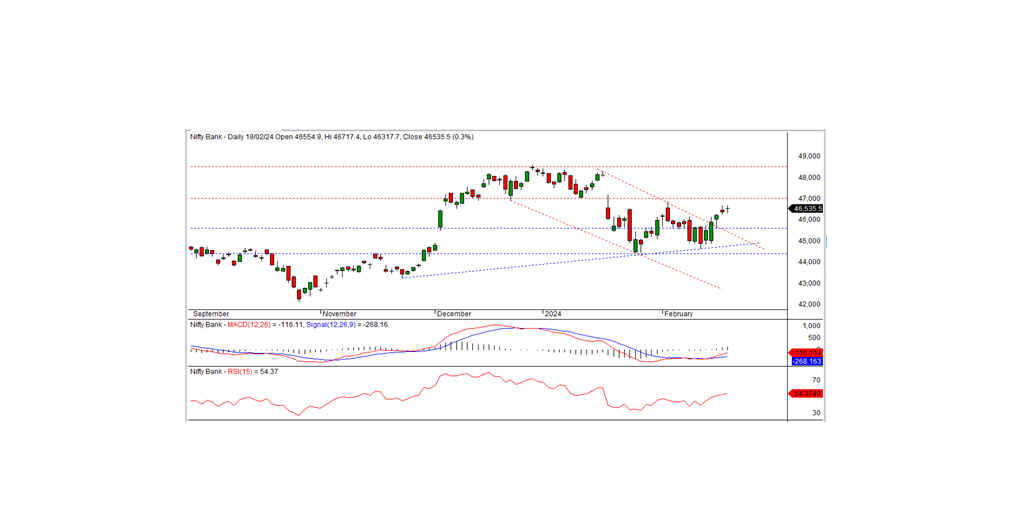
BANK NIFTY
In the previous trading session, Bank Nifty concluded at 46535.50, marking a gain of 150.65 points. From a technical perspective, momentum indicators signal a positive trend, and the Nifty remains above both short-term and long-term moving averages. A Doji candle formed on the daily chart and closed above the previous day's level, indicating favorable momentum for the bulls. The nearest intraday support stands at 46400, with resistance noted at 46700. Should the index surpass the resistance of 46700, bullish momentum is expected to continue, with the next short-term resistance level at 47000.
For intraday traders, support levels are identified at 46400, 46100, and 45800, while resistance levels can be observed at 46700, 47000, and 47200, as suggested by the 15-minute charts.
Positional traders are advised to monitor short-term support levels at 45600-44450, with resistance seen at 47000 - 48500.