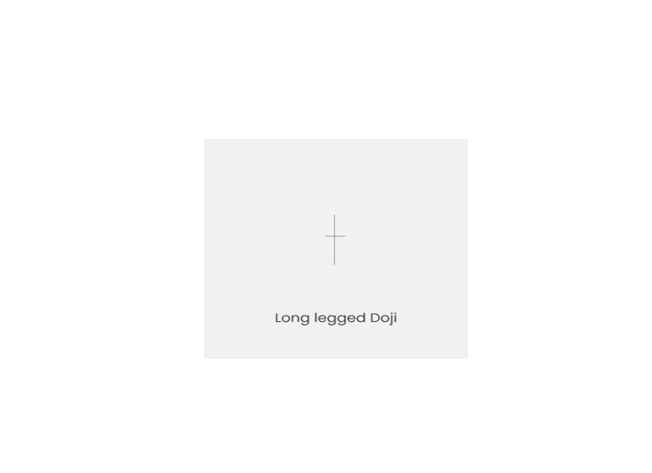
Long-legged Doji candlestick Pattern
Long-legged Dojis are candlestick patterns that have long upper and lower shadows and a relatively small real body. The real body refers to the difference between the opening and closing prices of the candlestick. In a long-legged Doji, the opening and closing prices are usually around the same level, resulting in a small real body.
The long upper and lower shadows indicate that there was significant price movement in both directions during the trading period, but the opening and closing prices ended up being close to each other. This pattern reflects market indecision and uncertainty, where buyers and sellers have had an equal amount of influence, resulting in an almost unchanged closing price.
Long-legged Dojis are often seen as a sign of a possible trend reversal, especially after a strong uptrend or downtrend. It suggests that the market is struggling to find a clear direction, and traders may need to be cautious about entering or exiting positions. They may also indicate a period of consolidation or a potential breakout from a tight trading range.
It is important to note that the significance of the long-legged Doji pattern depends on the context in which it appears, such as the trend direction, volume, and other technical indicators. Traders usually look for confirmation from other technical signals before making trading decisions based solely on the appearance of the long-legged Doji pattern.

