NIFTY TECHNICAL OUTLOOK
Based on Market Closing on Tuesday, January 09, 2024
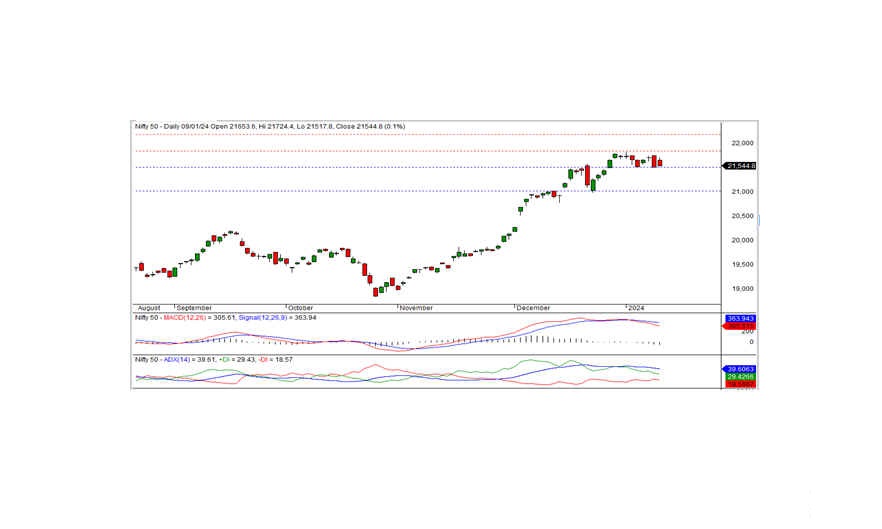
The Nifty concluded the trading session at 21544.85, marking a modest gain of 31.85 points or 0.15 percent. The short-term outlook suggests a potential shift to a downward trend if the Nifty falls below the support level of 21500.
Opening positively at the 21653.60 level, the Nifty reached an intraday high of 21724.40. However, during afternoon trade, the index experienced a downturn, hitting an intraday low of 21517.80 before settling at 21544.85. Among sectors, realty, auto, pharma, and metal witnessed gains, while media, financial services, banks, and FMCG faced losses. Market breadth remained positive, with 1283 stocks rising, 1128 falling, and 102 unchanged. Notable gainers under the Nifty included HEROMOTOCO, ADANI PORTS, APOLLOHOSP, and SBILIFE, whereas major losers were BRITANNIA, NESTLEIND, ASIANPAINT, and BAJAJFINSV.
From a technical standpoint, the Nifty continues to be below short-term moving averages, with momentum indicators signaling a negative trend. The daily chart displays a black candle, closing near the day's low, indicating a negative bias. On the downside, the index has short-term support at 21500. If the index trades and sustains below this level, the downtrend can continue in the coming days as well. The nearest intraday resistance is at 21580 levels.
Intraday Support Levels: 21500-21435-21370 Resistance Levels: 21580-21650-21725 (15-Minute Charts)
Positional Traders: Short-term support levels remain at 21500-21000, with resistance at 21835-22200.

BANK NIFTY
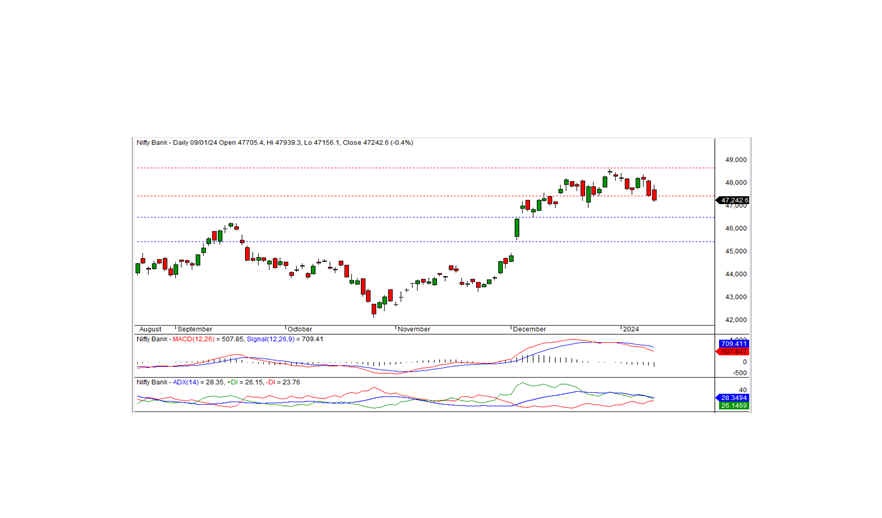
In the previous trading session, Bank Nifty closed at 47242.65, reflecting a loss of -207.60 points. From a technical standpoint, momentum indicators indicate a negative trend, and the index closed below the short-term moving averages. Additionally, the daily chart displays a black candle, closing below the previous support of 47400. If the index continues to trade and sustain below this level, the downtrend may persist in the coming days. The next short-term support is positioned at 46500. To initiate a pullback rally, the index must surpass the 47400 level.
For intraday traders, support levels are identified at 47200, 47000, and 46800, while resistance levels can be found at 47400, 47600, and 47800, as indicated by the 15-minute charts.
Positional traders are advised to monitor short-term support levels at 46500-45400, with resistance observed at 47400-48650.

