Inverted Hammer candlestick Pattern
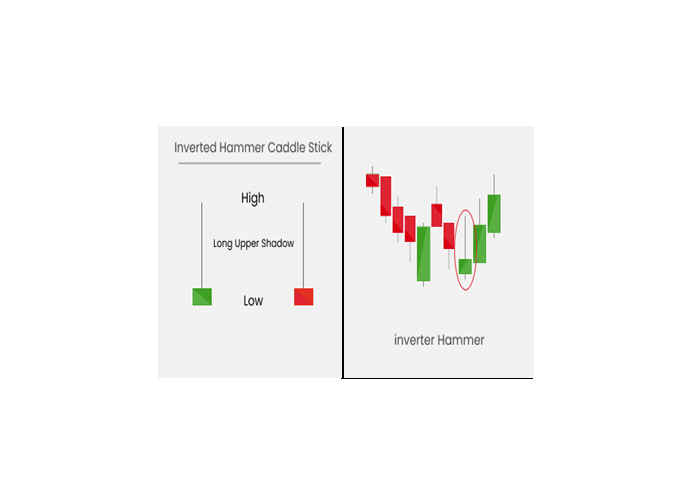
The Inverted Hammer candlestick pattern is a bullish reversal pattern that usually appears at the end of downtrends. This formation occurs when the open, low, and close prices are approximately the same, and there is a long upper shadow that is at least twice the length of the real body.
After a prolonged downtrend, the formation of an Inverted Hammer candlestick is considered bullish because it suggests that prices failed to decline further during the day, and buyers pushed the price upwards. The long upper shadow indicates that sellers pushed prices down to the opening price, but the increasing prices suggest that bulls are testing the strength of the bears. It's worth noting that the white Inverted Hammer candlestick is a stronger bullish signal than the black one.
To summarize, the Inverted Hammer candlestick pattern is a bullish reversal pattern that signals the potential for a bullish reversal at the end of a downtrend. The long upper shadow indicates that sellers pushed prices back to the opening price, but increasing prices indicate that buyers are testing the strength of the sellers. The white Inverted Hammer candlestick is a stronger bullish signal than the black one.

