NIFTY TECHNICAL ANALYSIS
SUMMARY OF MARKET CLOSING ON JANUARY 20, 2024
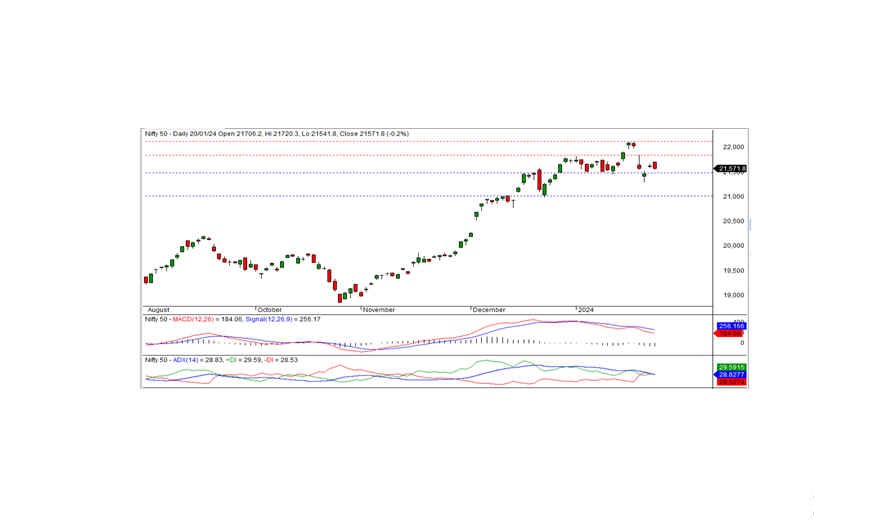
The Nifty concluded the latest trading session at 21,571.80, experiencing a modest decline of -50.60 points or -0.23 percent. If the index maintains its position above 21,500, the likelihood of sustaining a positive trend remains.
Commencing the day on a positive note at 21,706.20, the Nifty reached an intraday high of 21,720.30. However, the index gradually descended, touching an intraday low of 21,541.80 before settling at 21,571.80. Noteworthy sectors such as banks, financial services, metal, and media showed positive performance, while FMCG, IT, pharma, and realty faced declines. Market breadth leaned towards positivity, with 1,291 stocks rising, 1,138 falling, and 88 remaining unchanged.
Leading the gainers under the Nifty were COAL INDIA, ADANI PORTS, ADANIENT, and KOTAKBANK, while the major losers included HINDUNILVR, TCS, M&M, and INDUSINDBK.
From a technical perspective, the Nifty continues to hover below short-term moving averages, with momentum indicators signaling a negative trend. The daily chart displays a black candle and closing below the previous day's close. Notably, the index possesses short-term support at 21,500, and maintaining this level may pave the way for a positive trend in the coming days. However, failure to sustain above this level could lead to a continuation of the recent downtrend.
Intraday support levels are identified at 21,570, 21,475, and 21,400, with resistance levels at 21,660, 21,765, and 21,850 (15-minute charts). For positional traders, short-term support is crucial at 21,500-21,000, with resistance at 21,835-21,125.

BANK NIFTY ANALYSIS
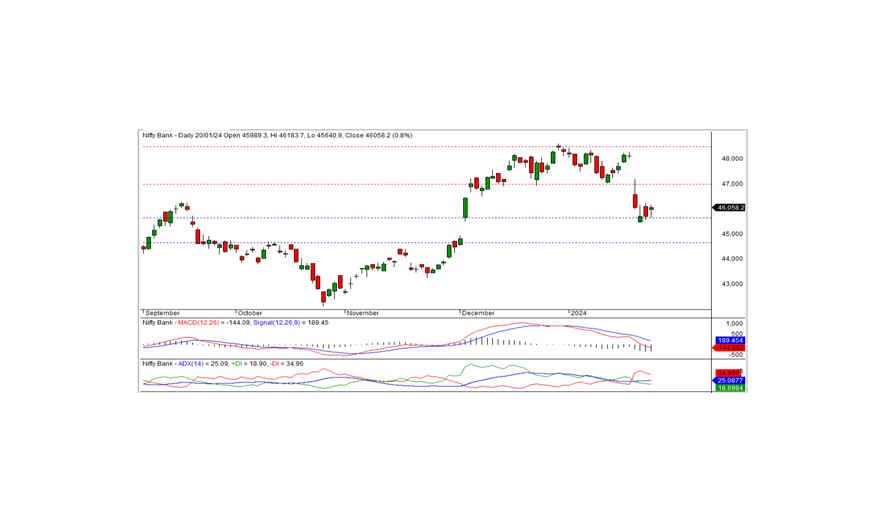
In the most recent trading session, Bank Nifty concluded at 46,058.20, marking an impressive gain of 357.05 points. From a technical standpoint, momentum indicators signal a negative trend, and the index remains positioned below both short-term and medium-term moving averages. Nevertheless, the daily chart shows a white candle, closing above the previous day's close.
On the upside, the index encounters intraday resistance at the 46,200 level. Should the index surpass this threshold, the positive trend may persist in the upcoming days. Conversely, if the index fails to breach this level, a consolidation phase below it might ensue for a brief period. The nearest short-term support is identified at the 45,600 level.
For intraday traders, support levels are situated at 46,000, 45,725, and 45,480, while resistance levels are observed at 46,200, 46,550, and 46,800, as indicated by the 15-minute charts.
Positional traders are advised to monitor short-term support levels at 45,600-44,650, with resistance levels established at 47,000-48,500. Keeping an eye on these levels will assist in navigating potential market movements in the coming sessions.

