
NIFTY TECHNICAL ANALYSIS
As of the market close on Monday, March 11, 2024.
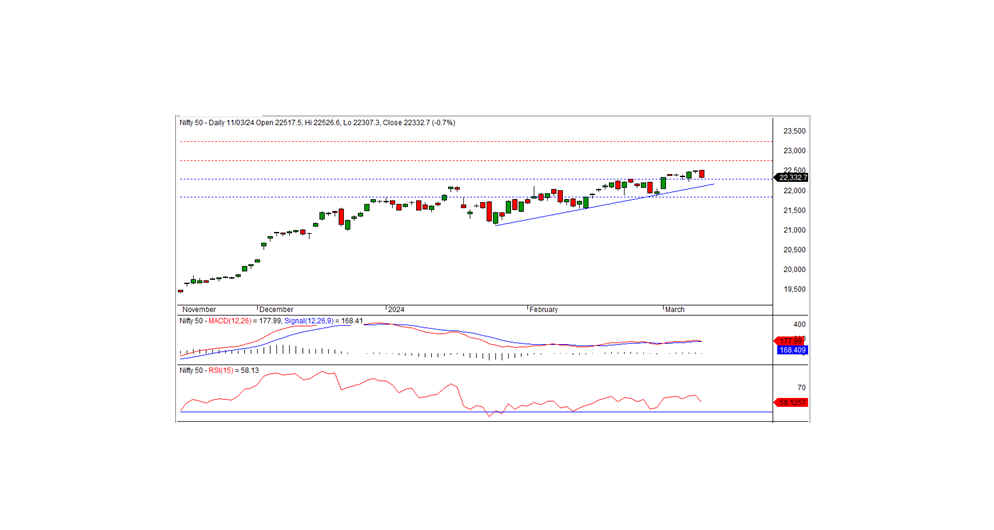
The Nifty concluded at 22,332.65, experiencing a decline of -160.90 points or -0.72 percent. The prevailing downtrend may persist should the Nifty continue to trade and sustain levels below 22,300.
During the last trading session, the Nifty commenced positively at the 22,517.50 level, reaching a morning high of 22,526.60. However, the index gradually receded, hitting an intraday low of 22,307.30 before settling at 22,332.65. Except for the pharma sector, all other sectors closed on a negative note, with media, PSU banks, metal, and realty sectors experiencing the most significant losses. The market breadth leaned towards the negative side, with 449 stocks advancing, 1,989 declining, and 116 remaining unchanged. Noteworthy gainers included APOLLOHOSP, NESTLEIND, SBILIFE, and CIPLA, whereas major losers comprised TATACONSUM, BAJAJ-AUTO, POWERGRID, and TATASTEEL.
From a technical perspective, the Nifty maintains a position above both short-term and long-term moving averages, with momentum indicators signaling a positive trend. After the preceding day's Doji candle, a black candle formed on the daily chart, indicating a negative trend. The index holds intraday support at the 22,300 level, and a sustained trade below this mark may trigger further downside movement. Otherwise, a rebound rally is anticipated from the support area. On the upside, the nearest intraday resistance is situated at 22,370 levels.
Intraday Levels: Support - 22,300, 22,225, 22,150 Resistance - 22,370, 22,450, 22,525 (15-Minute Charts)
Positional Trading: Short-term Support - 22,300-21,835 Resistance - 22,750-23,250.
BANK NIFTY ANALYSIS
In the most recent trading session, Bank Nifty concluded at 47,327.90, reflecting a decline of -507.95 points. From a technical perspective, momentum indicators continue to signal a positive trend, and the index maintains its position above both short-term and long-term moving averages. However, the daily chart reveals the formation of a black candle, with the index closing near the day's low.
On the downside, the index finds short-term support at the 47,200 level. A potential continuation of the downtrend may occur today if the index falls below this critical level. The nearest intraday resistance is identified at the 47,450 level, and a successful surpassing of this level is essential for any pullback rally.
For intraday traders, support levels are positioned at 47,200, 47,000, and 46,800, while resistance levels can be observed at 47,450, 47,600, and 47,800, as indicated by the 15-minute charts.
Positional traders are advised to monitor short-term support levels at 47,000-45,300, with resistance identified at 48,500-50,000. Careful consideration of these levels will help inform trading decisions for the more extended time frame.
