Hanging man candlestick Pattern
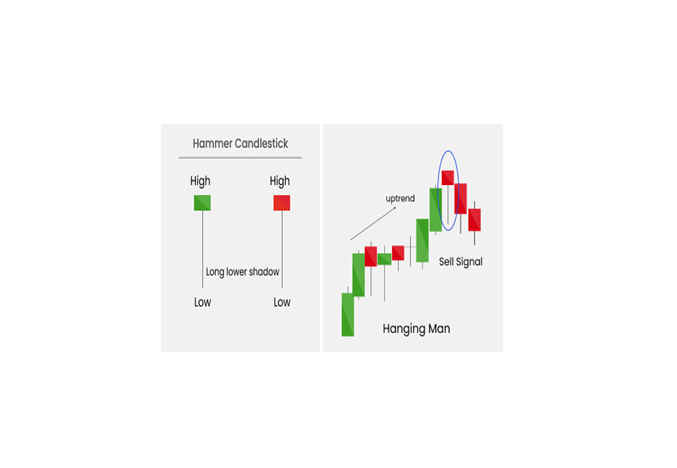
The hanging man candlestick pattern is a bearish trend-reversal pattern that typically occurs after an uptrend. It has a small real body and a long lower shadow that is at least twice as large as the real body. Although the shape of the hanging man pattern is similar to the hammer pattern, which is a bullish trend-reversal pattern, the main difference between the two patterns is the trend in which they occur.
When the hanging man pattern appears during an uptrend, it indicates that buyers may have lost strength and momentum, which could be an early sign that the stock or index may be about to change its direction. It does not necessarily mean that buyers have lost control, but most investors believe that the price has reached its peak, and a reversal is likely.
The hanging man candlestick can either be green (bullish) or red (bearish), although the red candle gives a better indication of a weakening market. Therefore, a red-hanging man candle is a stronger bearish signal than a green one.
In summary, the hanging man candlestick pattern is a bearish trend-reversal pattern that appears after an uptrend. It signals that buyers may have lost strength and momentum, which could lead to a reversal in the stock or index's direction. Traders should consider combining the hanging man pattern with other technical indicators and analysis tools to make informed trading decisions and manage risk effectively.

