Hammer candlestick Patterns
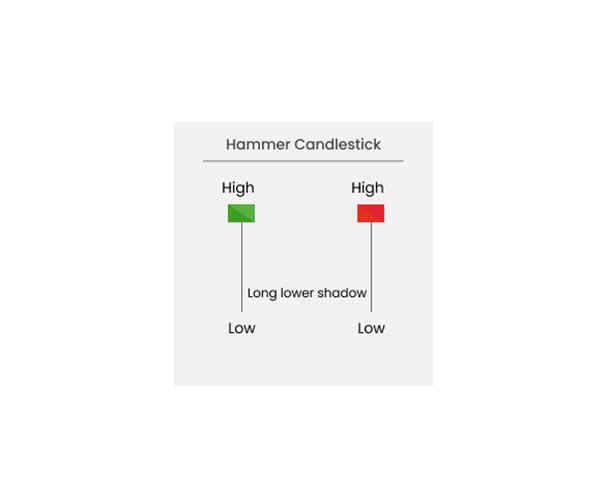
The hammer candlestick pattern is a bullish trading pattern that signals a possible trend reversal in a stock that has reached its bottom. This pattern forms when sellers push the price down, but buyers drive the asset price up at the closing time, resulting in a small body and a long lower shadow. The lower shadow of the candlestick should be at least twice as large as the real body.
There are two types of hammer candles: green (white) and black, and the color does not hold much significance. The hammer candlestick pattern signifies the market's attempt to establish a bottom after a downtrend, and the most effective hammers form after three or more declining candles. However, it's important to note that this bullish pattern does not mean that buyers have taken control of the market. Rather, it indicates that their strength is increasing, which may lead to a trend reversal.
To confirm the hammer pattern, the next candle should close above the hammer candle's closing price. This will indicate that buyers have continued to gain strength and the trend may be reversing. However, traders should combine the hammer pattern with other technical indicators and analysis tools to make informed trading decisions and manage risk effectively.
Overall, the hammer candlestick pattern can provide valuable insights into market trends and help traders make informed decisions about buying and selling stocks. By paying attention to these patterns and using them in conjunction with other analysis tools, traders can increase their chances of success in the stock market.

