NIFTY Technical Outlook
Market Closing: Monday, October 28, 2024
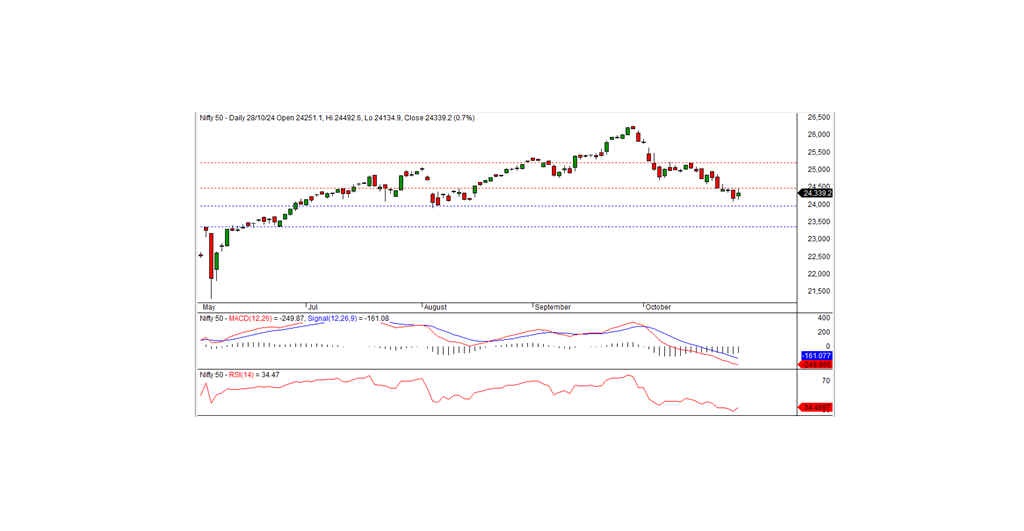
In the last trading session, Nifty closed at 24,339.20, gaining 158.35 points or 0.65%. The index shows a positive bias, which may continue if it moves above the intraday resistance at 24,400.
Market Recap:
Nifty opened positively at 24,251.10, briefly dipping to an intraday low of 24,134.90 before rising to test the intraday high of 24,492.60, ultimately closing at 24,339.20. All sectors closed positively, with PSU banks, metals, media, and realty emerging as the strongest gainers. The market breadth was positive, with 1,907 stocks advancing, 941 declining, and 71 remaining unchanged. Top Nifty gainers included Shriram Finance, Adani Enterprises, ICICI Bank, and JSW Steel, while Coal India, Bajaj Auto, Axis Bank, and Hero MotoCorp were the leading losers.
Technical Overview:
Momentum indicators suggest a negative trend, with the Nifty still below its short- and medium-term moving averages. However, a white candle formed on the daily chart, closing within the previous candle’s range, which could indicate a consolidation phase. Nifty has intraday support at 24,300 and resistance at 24,400. If the index sustains above 24,400, it may extend its positive momentum; a drop below 24,300 could signal a mild downside.
Intraday Levels: Support: 24,300, 24,220, 24,130 Resistance: 24,400, 24,500-24,600 (15-minute charts)
Positional Levels: Support: 24,000 - 23,365 Resistance: 24,500 - 25,200

Bank Nifty Technical Outlook
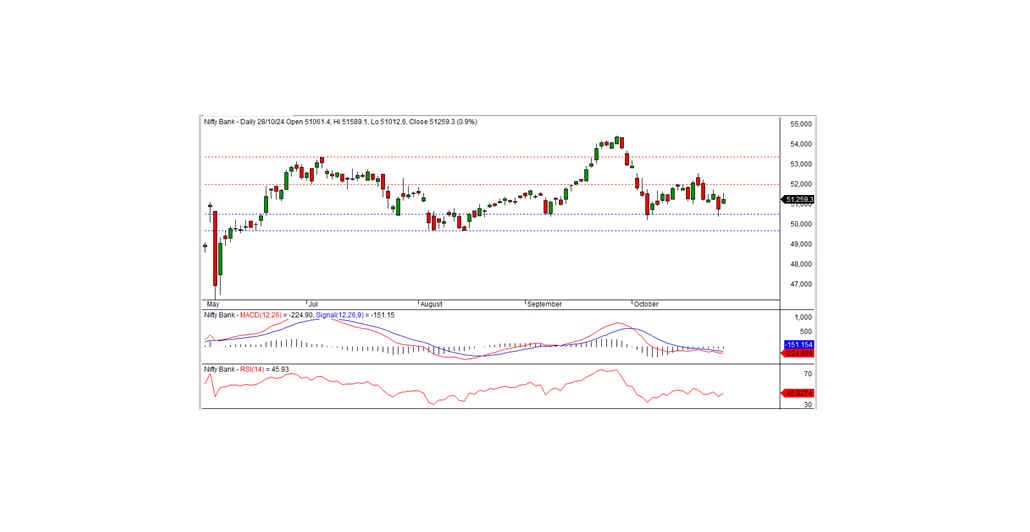
In the last trading session, Bank Nifty closed at 51,259.30, gaining 471.85 points. Technically, momentum indicators still point to a negative trend, with the index below its short-term moving averages. However, a white candle formed on the daily chart, closing within the previous day's range, suggesting potential consolidation. Bank Nifty has immediate support at 51,250 and resistance at 51,600. A move above 51,600 could signal further upside in the coming days, while staying below may lead to continued consolidation.
Intraday Levels (15-Minute Chart): Support: 51,250, 51,000, 50,700 Resistance: 51,600, 51,800, 52,100
Positional traders should watch short-term support at 50500–49650, with resistance at 52000–53350.

